
What Is Average Time on Page in Google Analytics?
Average time on page was a Google Analytics metric that helped determine how long users engaged with your website content. It measured the average amount of time your users spent on any given page on your site.
This was in Universal Analytics (UA), and the metric no longer exists in that form in Google Analytics 4 (GA4). The closest representation is now Average Engagement Time.
Average Time on Page vs. Average Engagement Time in Google Analytics
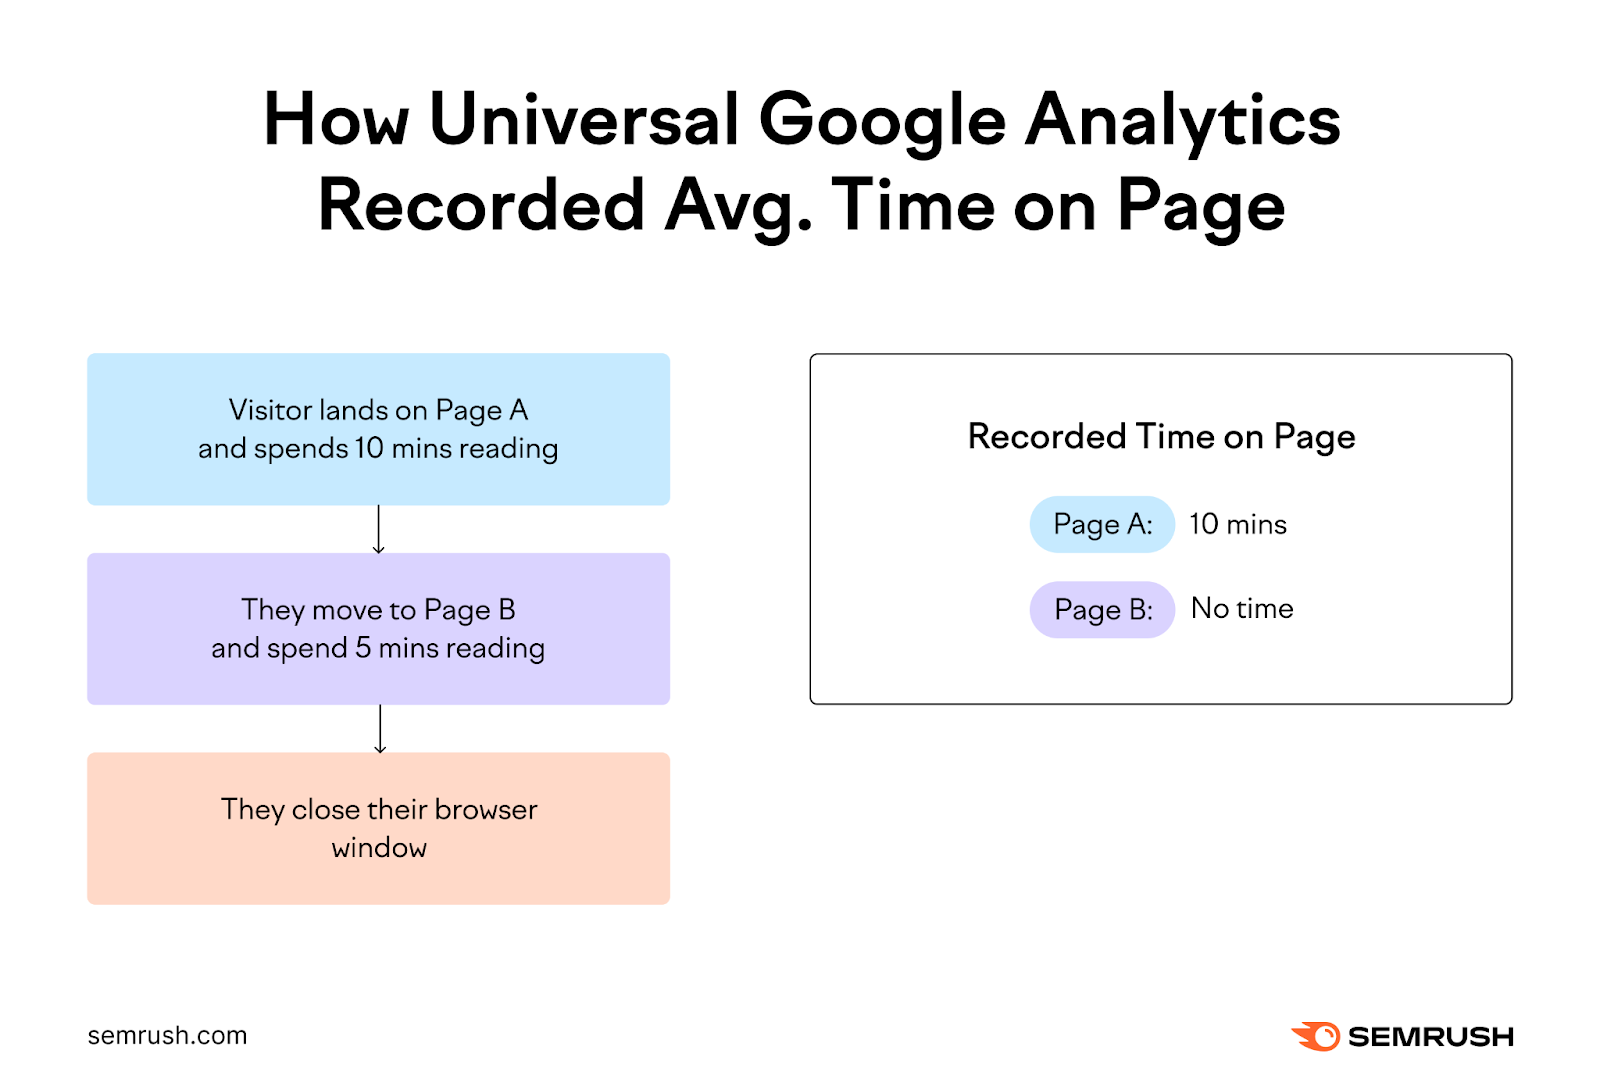
In the past, Google Analytics only recorded the time between a user landing on one page and navigating to another on your site. It relied on the time of the next page view to determine how long the visitor spent on a given page.
This meant the tool couldn’t record the time a user spent on the last page of their visit. As there was no “next” page view (on your site) to get the time from.
But in GA4, average engagement time captures a user’s total time engaging with a page, including instances where the page may be the last one in their session.
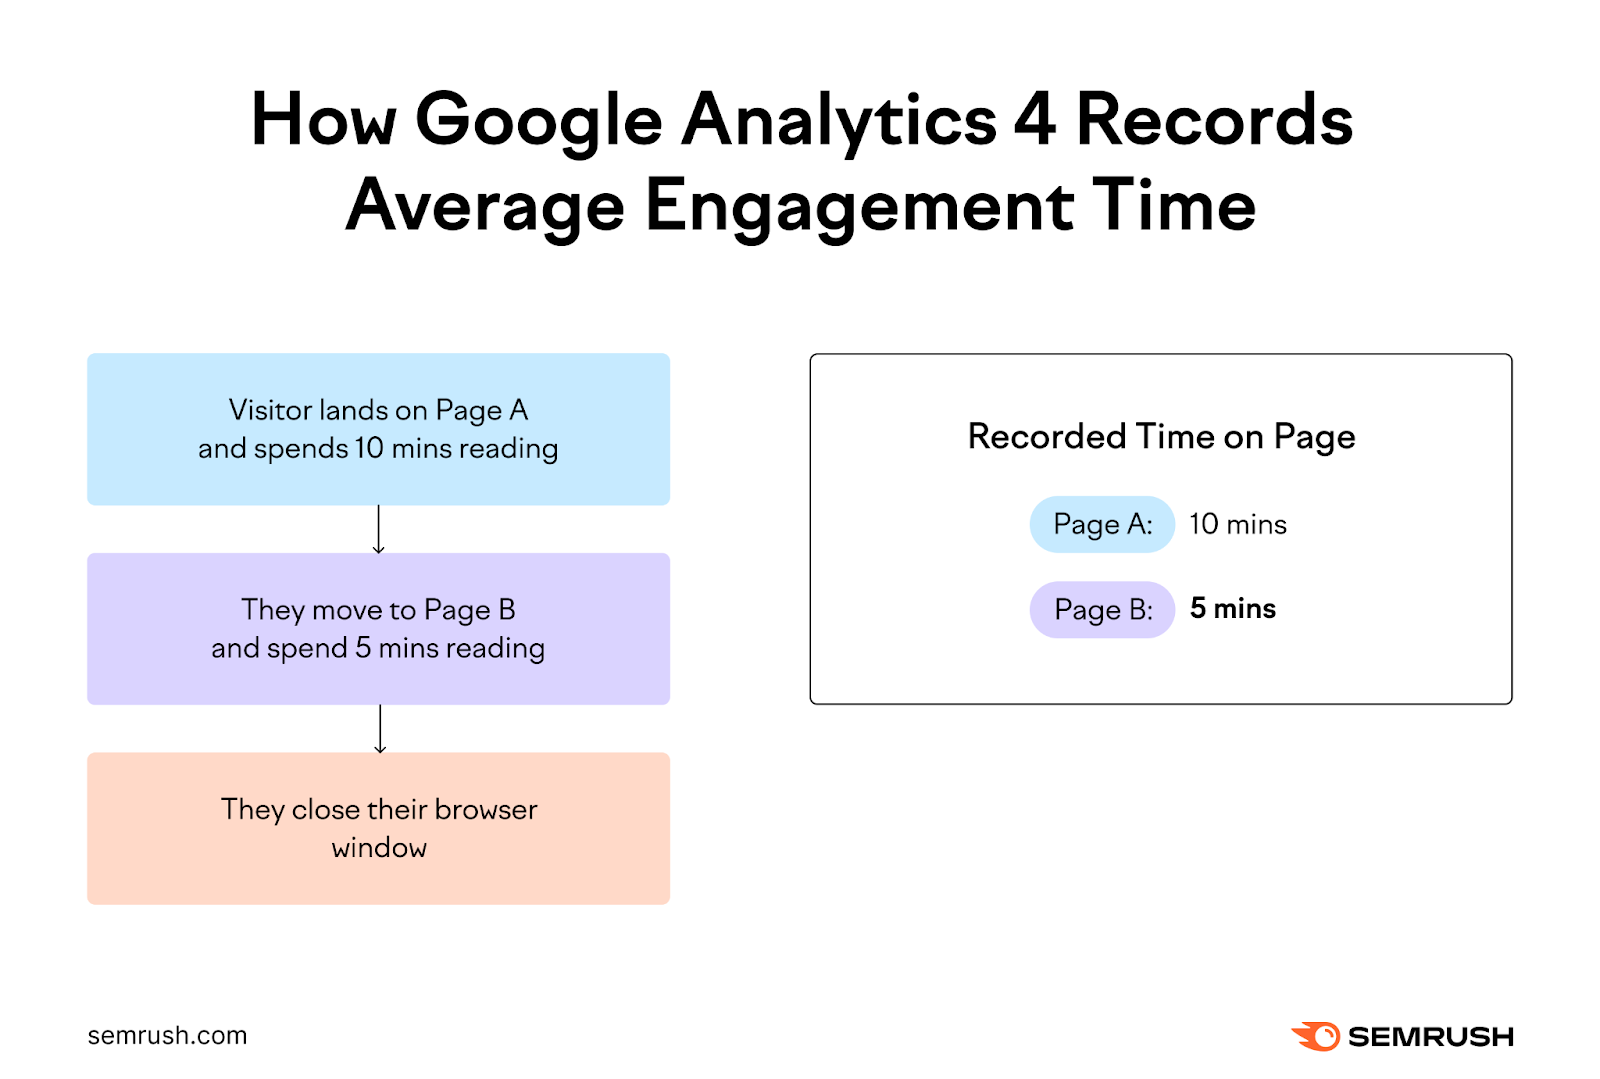
This gives a more accurate picture of user engagement, as it also accounts for those visitors who may only visit a single page on your site.
Although the metrics have different names, the core idea remains the same: measuring how long visitors interact with your content.
How to See Time on Page in Google Analytics 4
There are a few different ways to find your average time on page in GA4.
How to Find Your Website’s Average Engagement Time
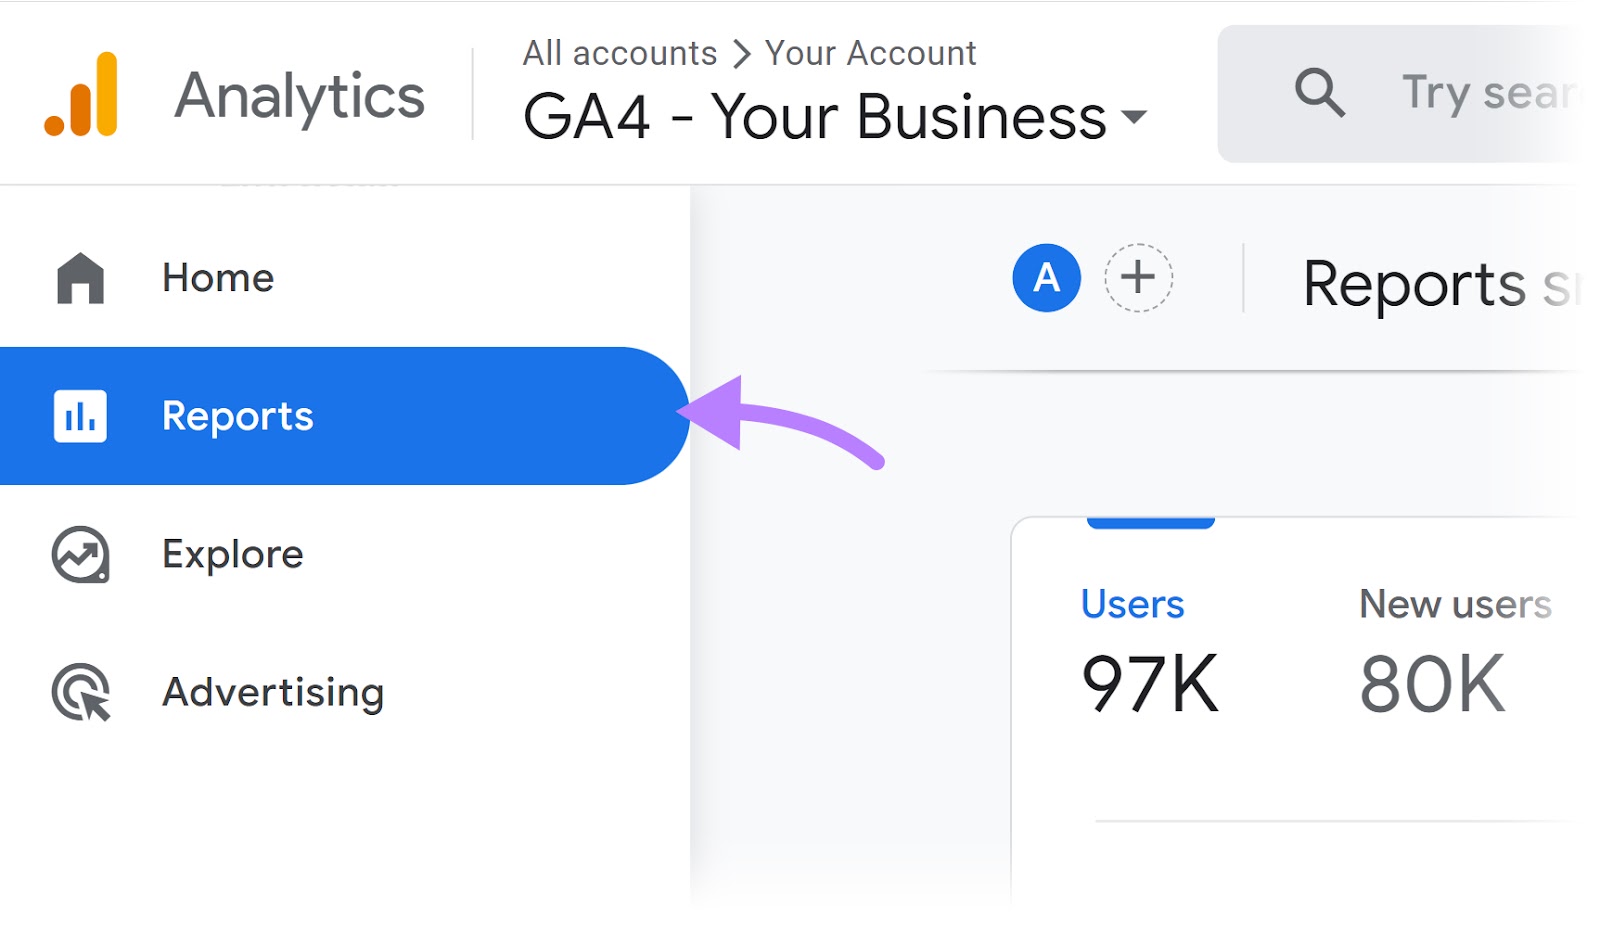
To view your website’s overall average engagement time in Google Analytics 4, click “Reports” in the left-hand navigation bar.
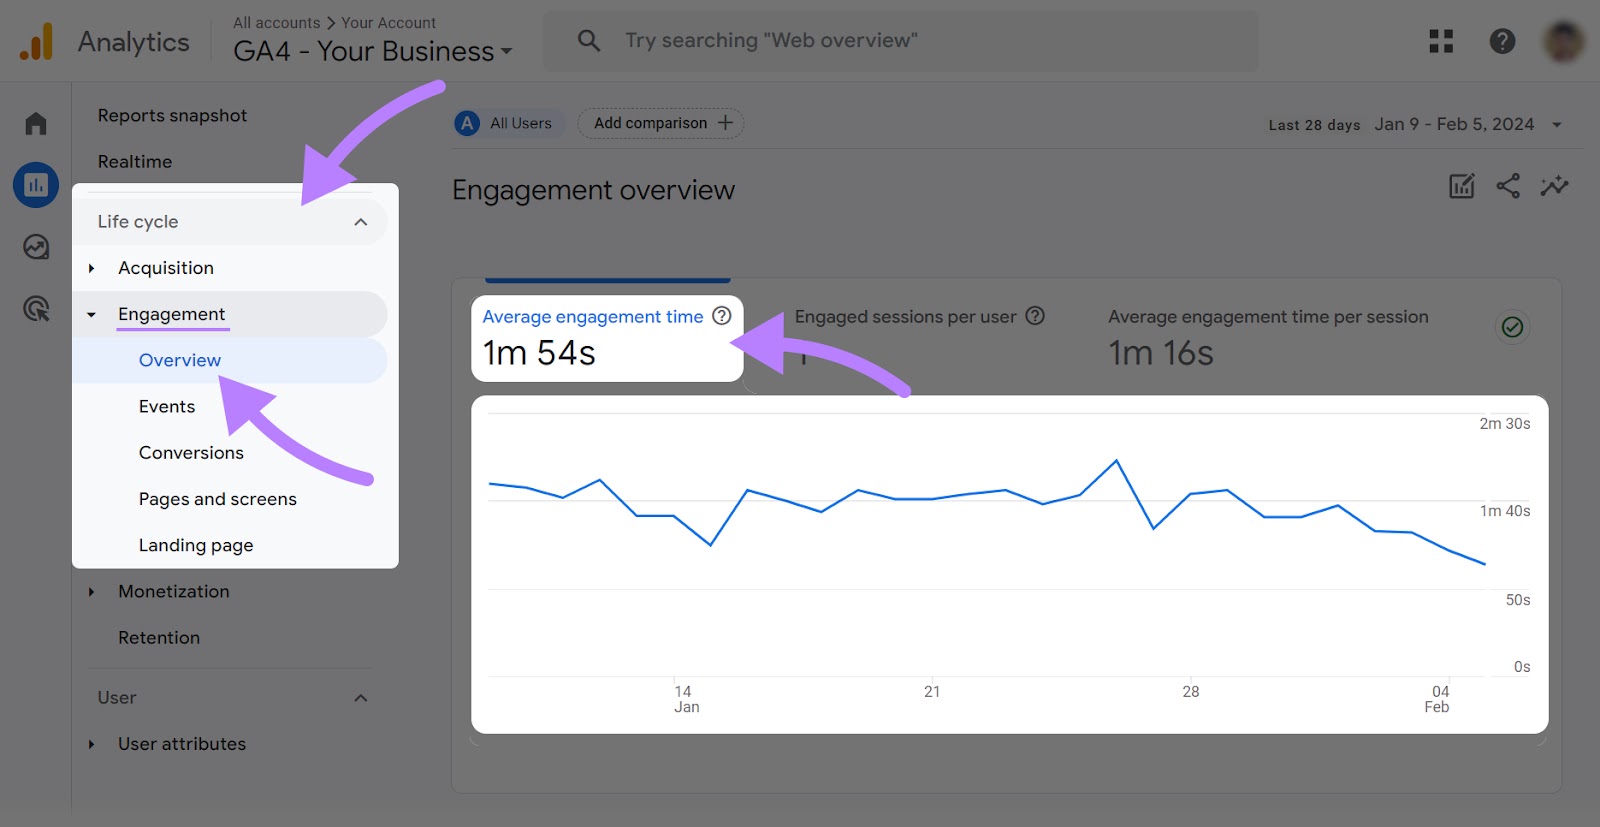
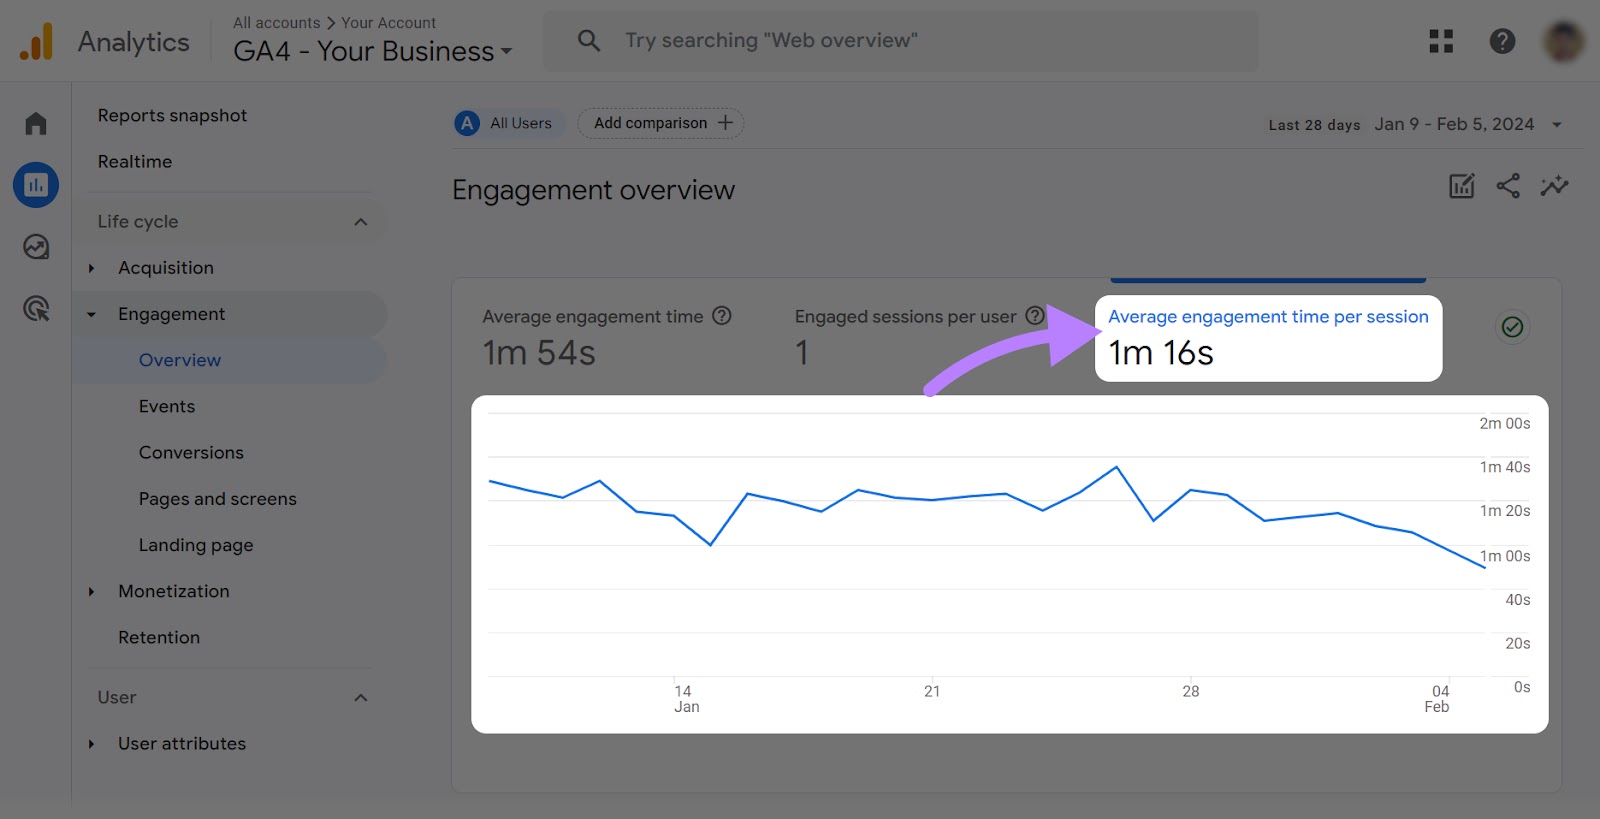
Then click “Life cycle” > “Engagement” > “Overview.” This will show you the average engagement time across your entire website.
How to Find Your Website’s Average Engagement Time per Session
To see your average engagement time per session, click “Average engagement time per session.”
This number will be slightly different from the average engagement time, as your website’s number of sessions will likely differ from your number of users.
How to Find Average Engagement Time by Page
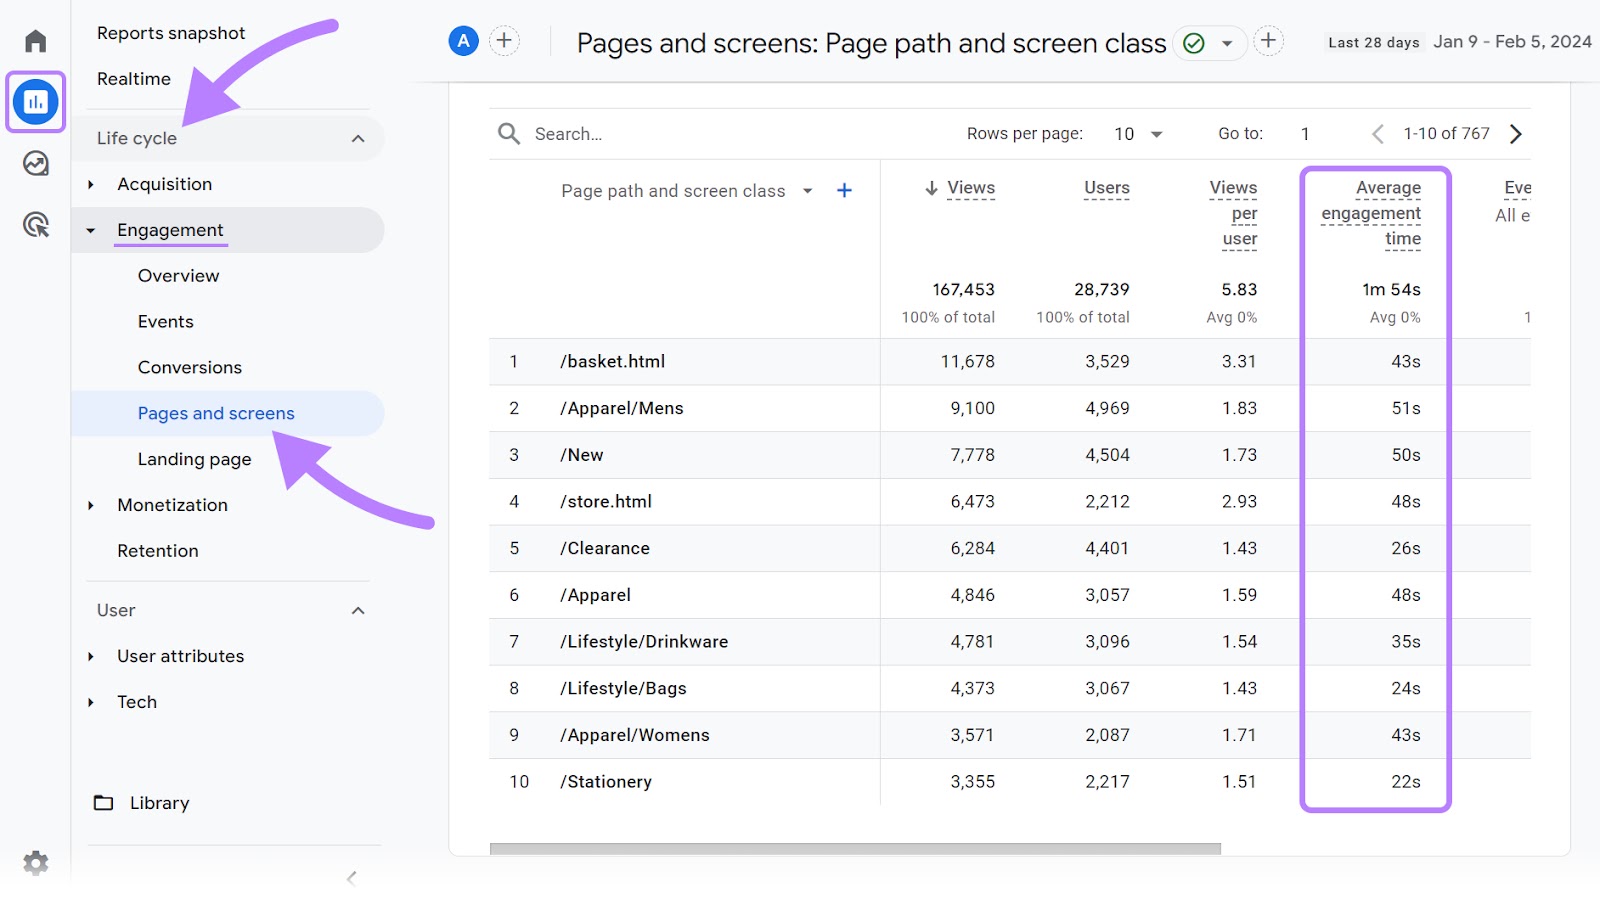
You can see a breakdown of your average engagement time by page by going to the “Average engagement time” column under “Reports” > “Life cycle” > “Engagement” > “Pages and screens.”
You can sort by average engagement time, ordering them from lowest to highest, to find pages that have a low average engagement time. You may want to update these pages to improve engagement.
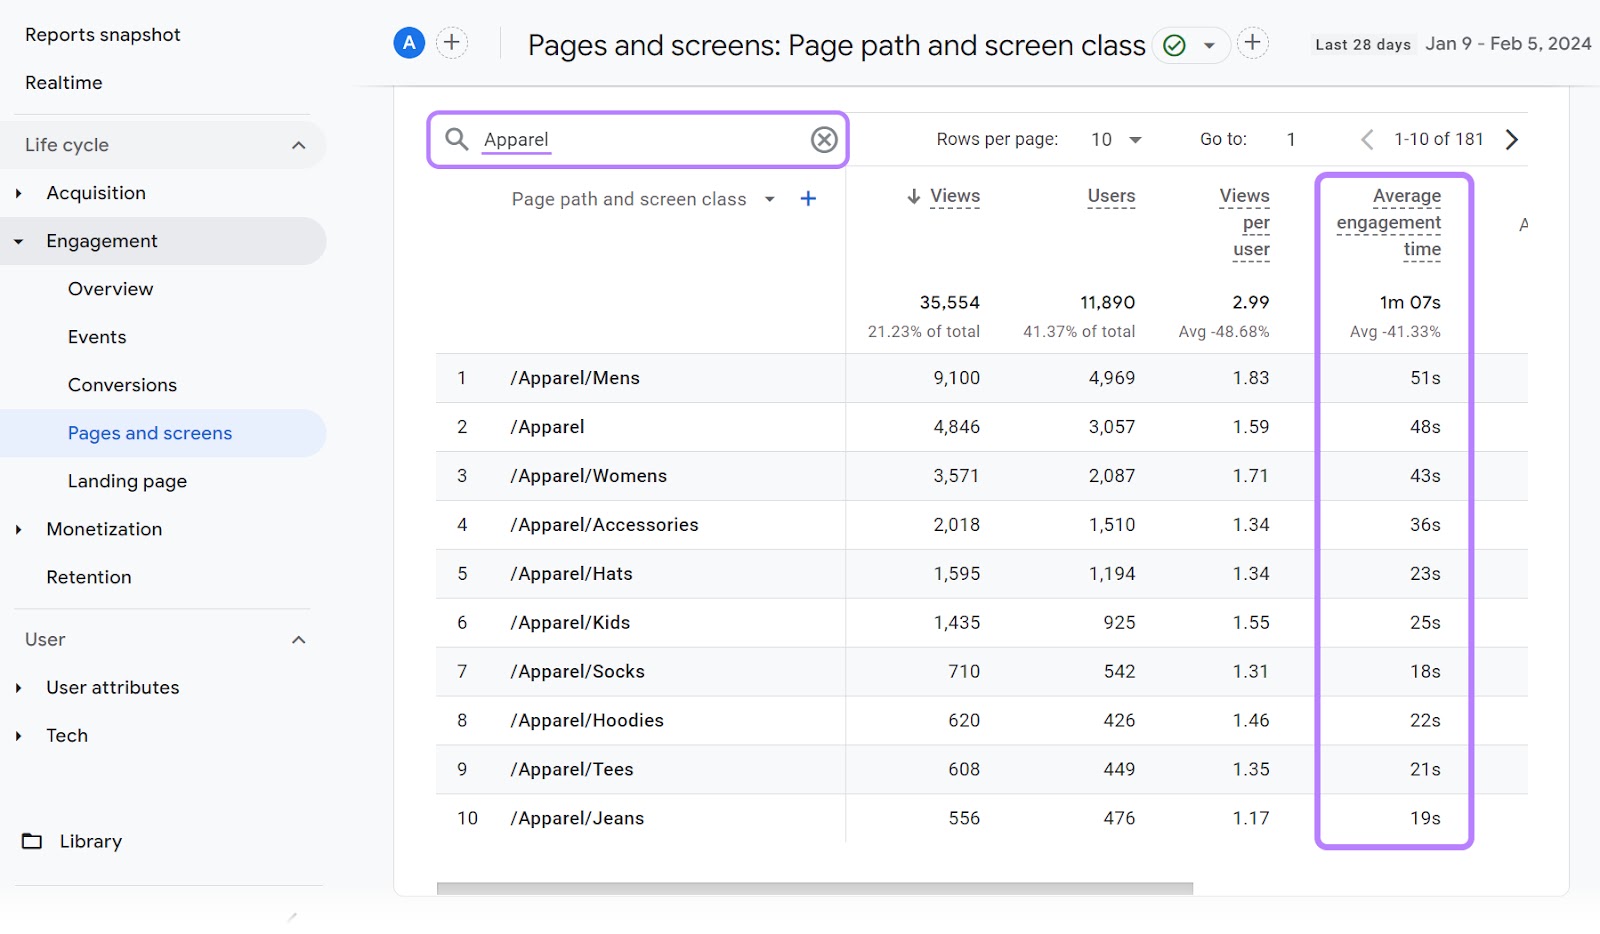
You can find the average engagement time for a specific page or group of pages by using the search bar above “Page path and screen class.”
Why Is Time on Page an Important Metric?
Time on page is an important metric to track because it indicates how engaging your content is for your readers.
Google Analytics metrics like users and page views are a good indication of your website’s traffic. But they don’t offer a deeper understanding of how well your content is serving your users’ needs.
If your blog is reaching thousands of readers every month, it might appear to be successful. However, if most people coming to your site are leaving within a few seconds of landing on the page, your content likely isn’t resonating with your readers.
Average engagement time is a helpful metric to monitor your SEO results because it can help you determine whether visitors are genuinely engaging with your content.
What Is a Good Average Time on Page?
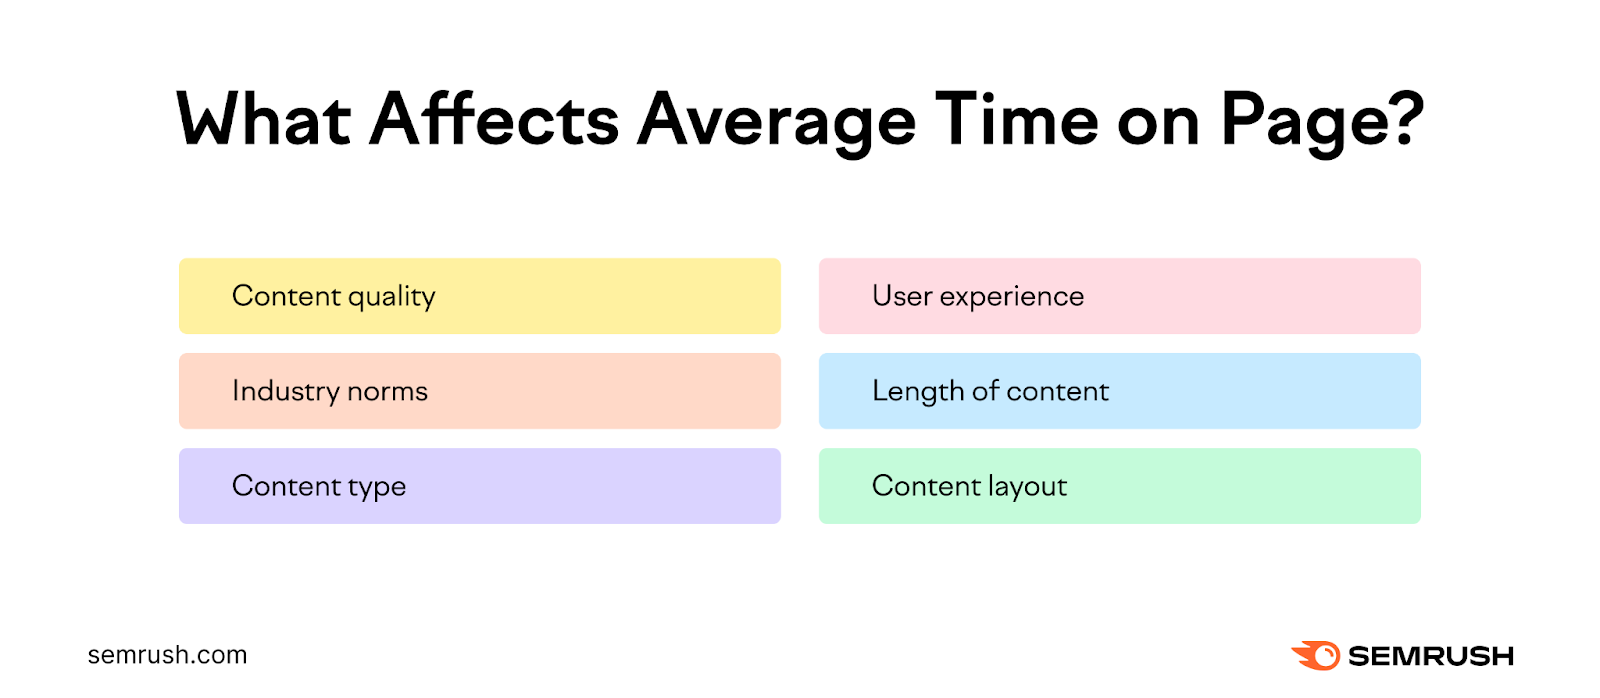
A good average time on page varies based on factors like your industry, the type of content you have on your website, and user behavior patterns.
For example, an in-depth article on a complex topic should have a longer average time on page compared to a glossary page that defines a term in one paragraph. A reader might spend 15 minutes on the longer article, and just one minute on the glossary page.
But both of these might be serving the user with exactly what they need. So you need to take into account various factors when assessing your site’s average time on page.
Long vs. Short Average Time on Page
A short average time on page can indicate a misalignment between what your users expect and what they find on the page—or it could be a sign of effective, concise content. If a reader gets what they need quickly, you’ve probably served them well.
A longer time on page generally suggests deeper engagement. But if a reader is spending a long time reading your content and not taking specific actions (like signing up for an email list or buying a product), then it may not be aligned with your business’s goals.
You need to analyze your website, industry, and the type of content you produce to understand what a “good” average time on page looks like.
How to Increase Your Average Time on Page
If you find that your website’s average time on page is much lower than it should be, there are some simple ways to increase it.
1. Produce High-Quality Content
High-quality content that resonates with your readers and aligns with what they are looking for can keep them engaged for longer.
Understanding your audience’s search intent (why they enter a specific search query) will help you create relevant content that provides them with what they need.
You can ask yourself:
What are the questions and problems your audience has related to your products, services, or field of expertise?
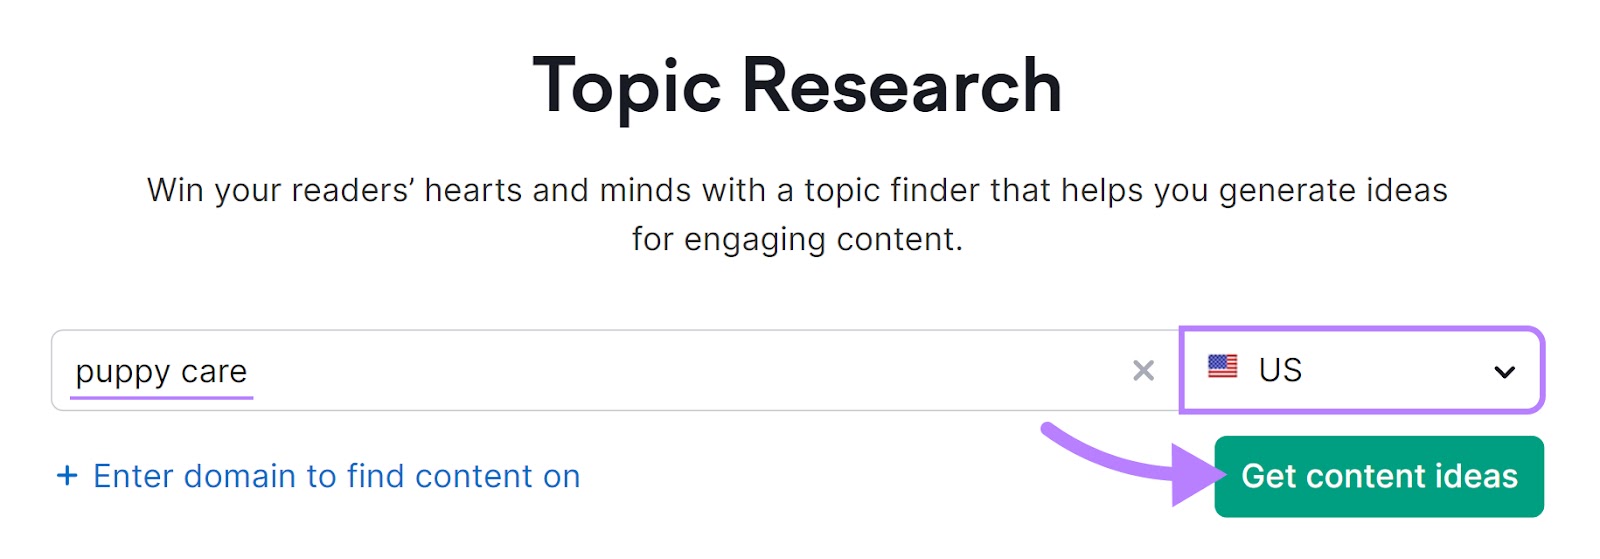
You can use the Topic Research tool to find relevant topics that your audience cares about. Along with related questions you may want to answer within your content.
Enter a topic, select a location, and hit the “Get content ideas” button.
The tool will generate cards of relevant subtopics and ideas to include in your content.
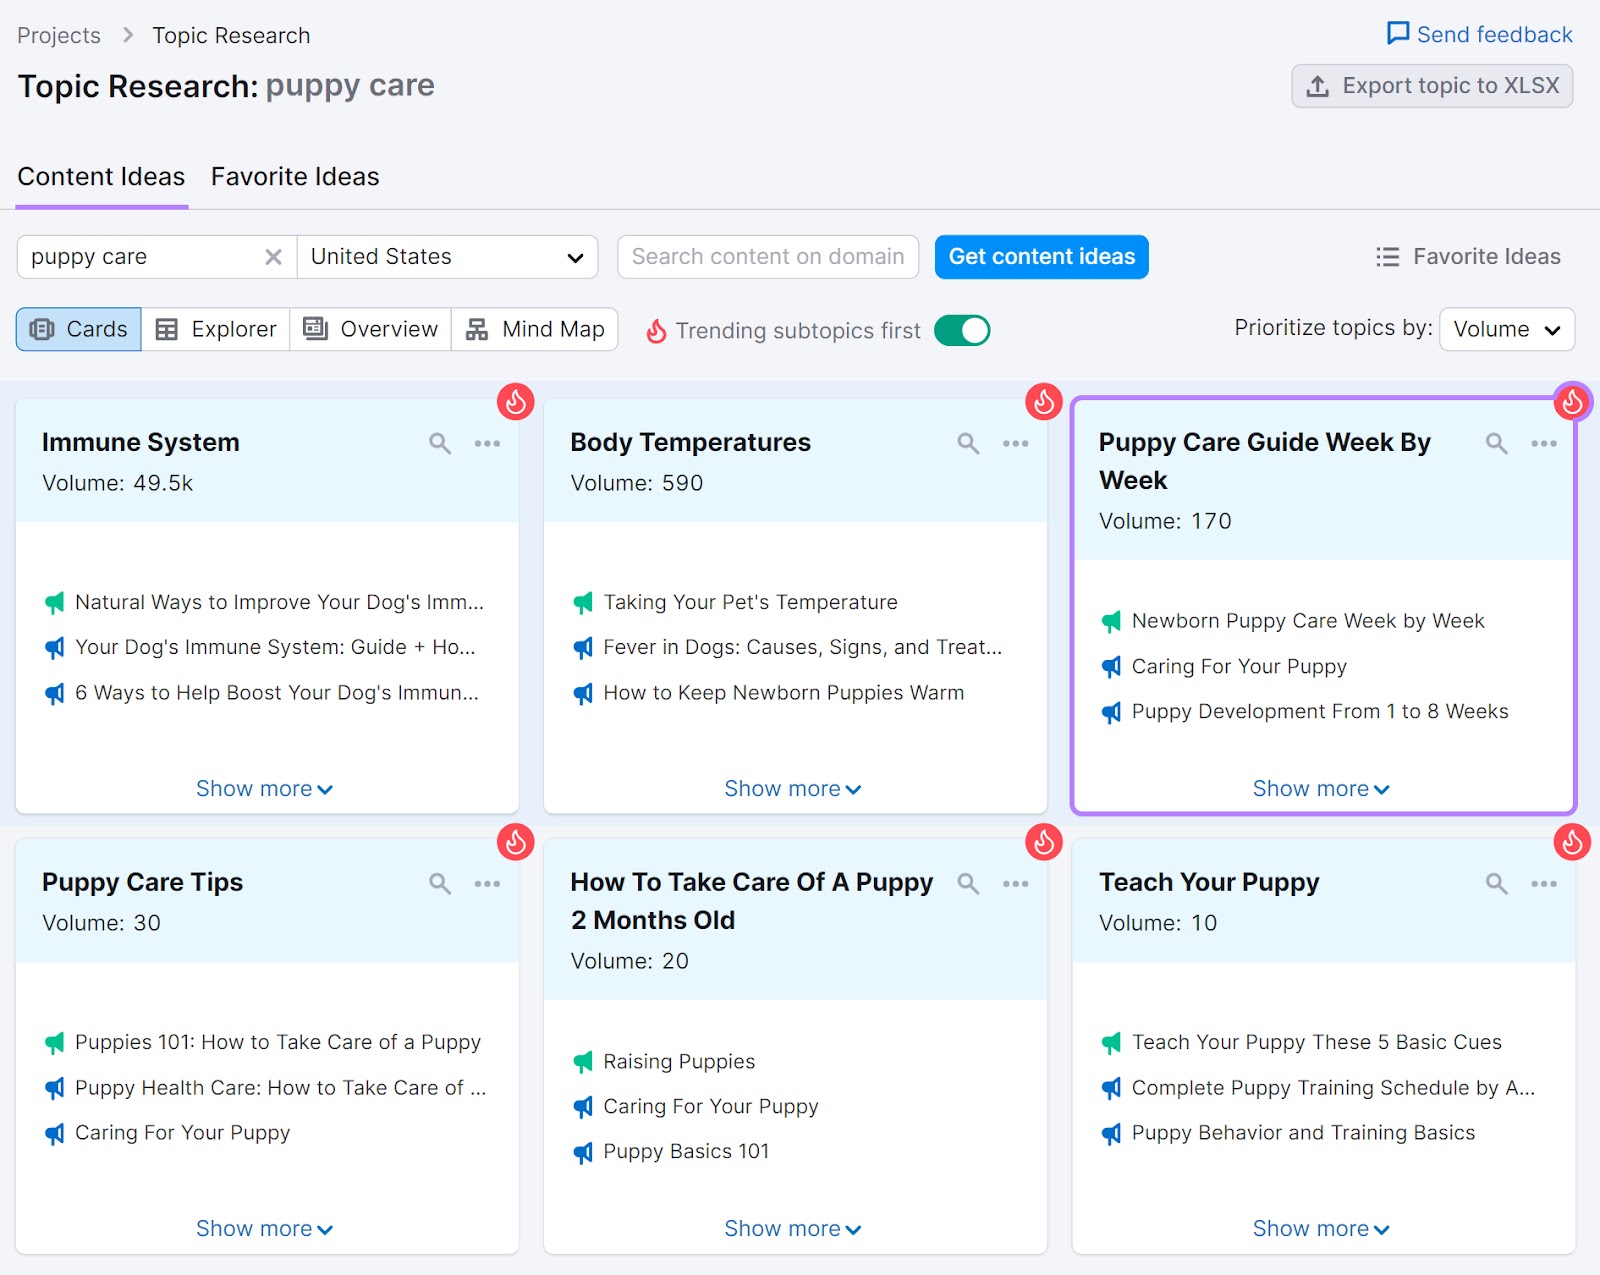
Click on a card to view more details like top-shared headlines, questions and related searches on that topic. You’ll also see metrics like search volume, keyword difficulty, and topic efficiency.
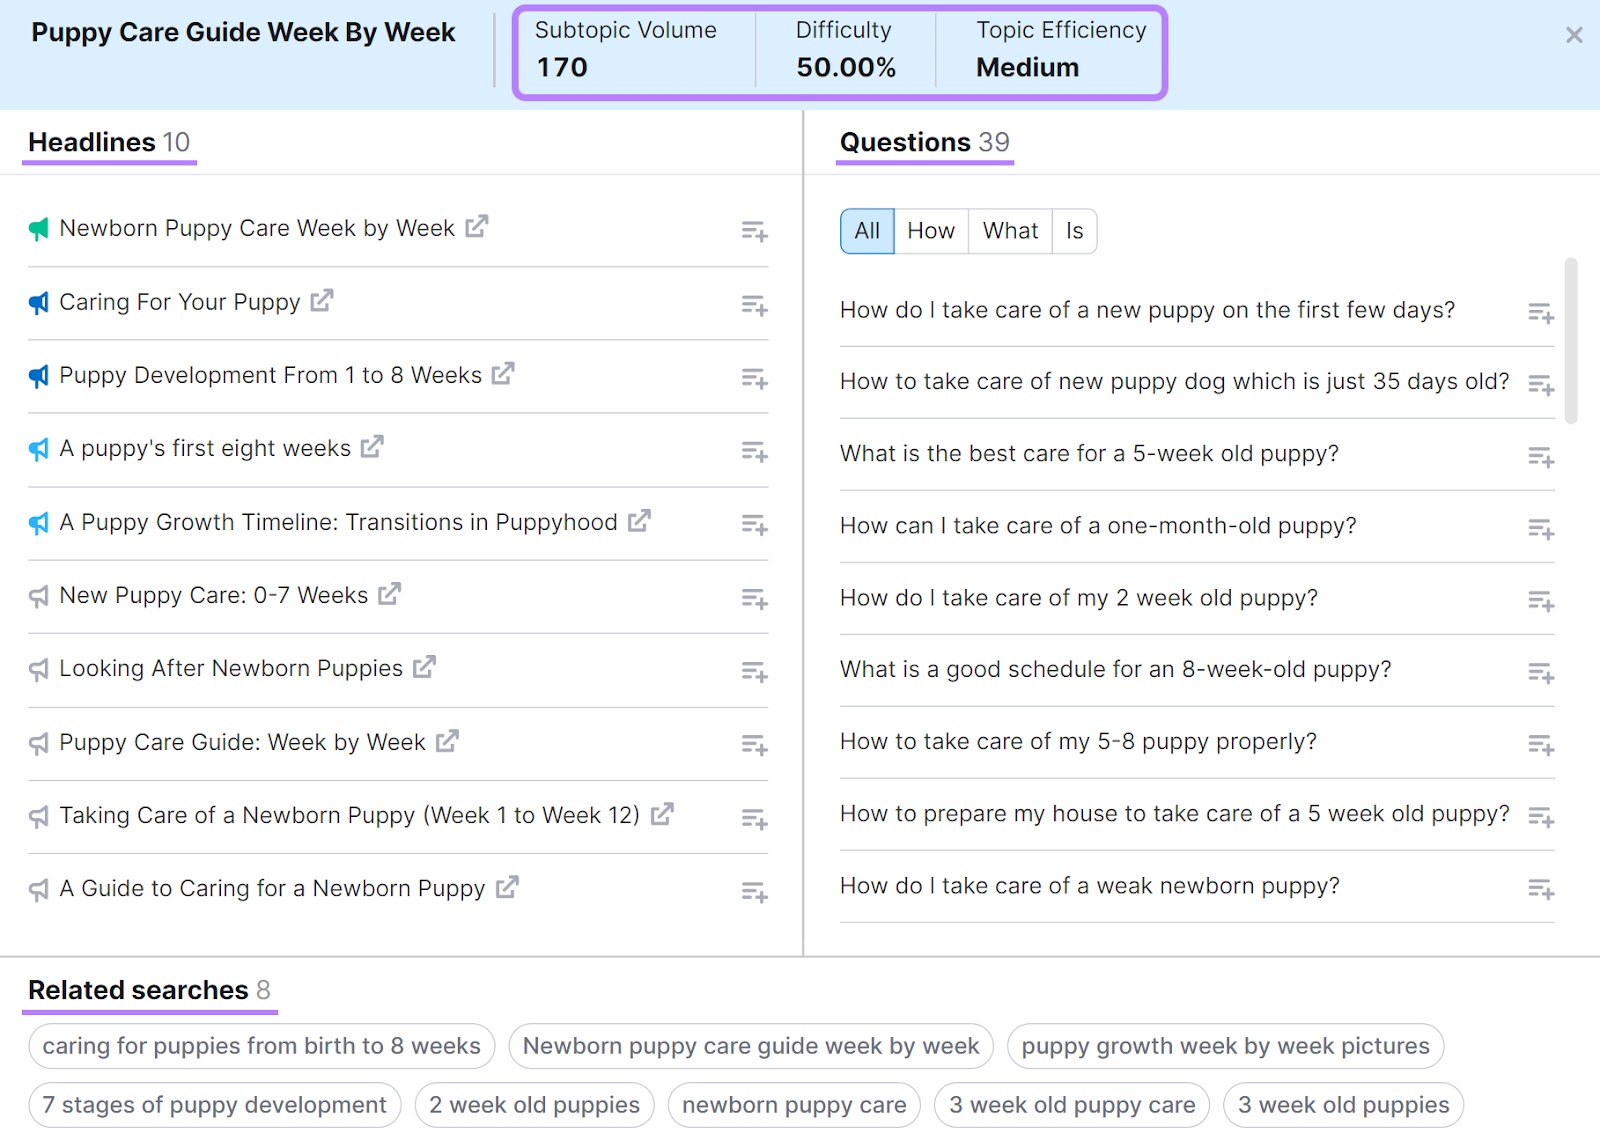
Pick the most relevant topics and questions to include in your content as subheadings. This ensures you cover the most important information for your readers, and it can help keep them engaged for longer. Increasing your time on page.
2. Use the Right Content Format for Your Audience
Serving the right type of content to your readers is key for increasing your average engagement time.
Here are some ideal content formats for various situations:
- Listicles: Best for topics that benefit from a quick, easy-to-scan format. Ideal for presenting tips, steps, or recommendations in a structured way.
- How-to guides: Effective for detailed, instructional content. Suitable for audiences seeking comprehensive, step-by-step information on specific tasks or processes.
- Short-form articles: Great for concise overviews or updates. Best for audiences looking for quick insights or summaries without deep dives into the subject matter.
- Long-form articles: Ideal for thorough exploration of complex topics. Ideal for readers who prefer comprehensive, detailed analysis and discussion.
You can create content that incorporates two or more content formats. It depends on what helps you communicate the topic in the most relevant and helpful way to your target audience.
Find out the best content format for your readers by looking at the types of content that rank high on search engine results pages (SERPs) for your target keywords. And by reviewing which content formats your competitors are using successfully.
3. Make Your Content Easy to Read
Making your content easy to read allows your audience to focus on the value you’re providing. Don’t just show them a wall of text.
Instead, break down the content into short, digestible sections with clear headings, bullet points, and concise paragraphs.
Also add useful images and graphics to break up the text even further. This helps your readers scan the page for the information they need. And relevant images can be highly engaging, helping boost your time on page.
Use Semrush’s SEO Writing Assistant to test your content’s readability.
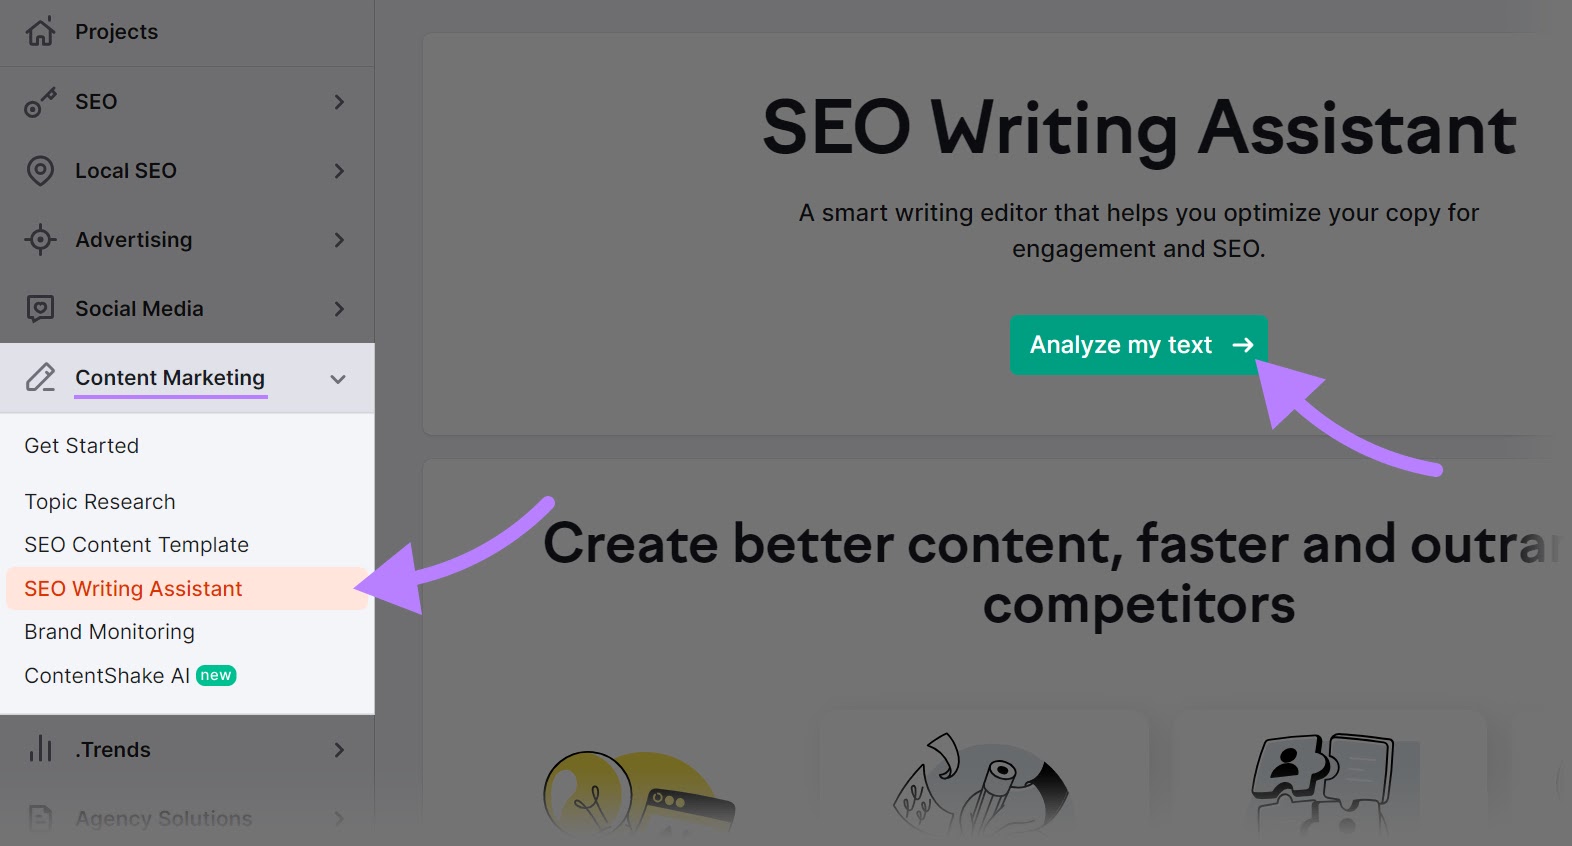
Click on “SEO Writing Assistant” under ““Content Marketing.” Then, click the “Analyze my text” button. (If you’ve used the tool before, you’ll click “+ Analyze new text” instead.)
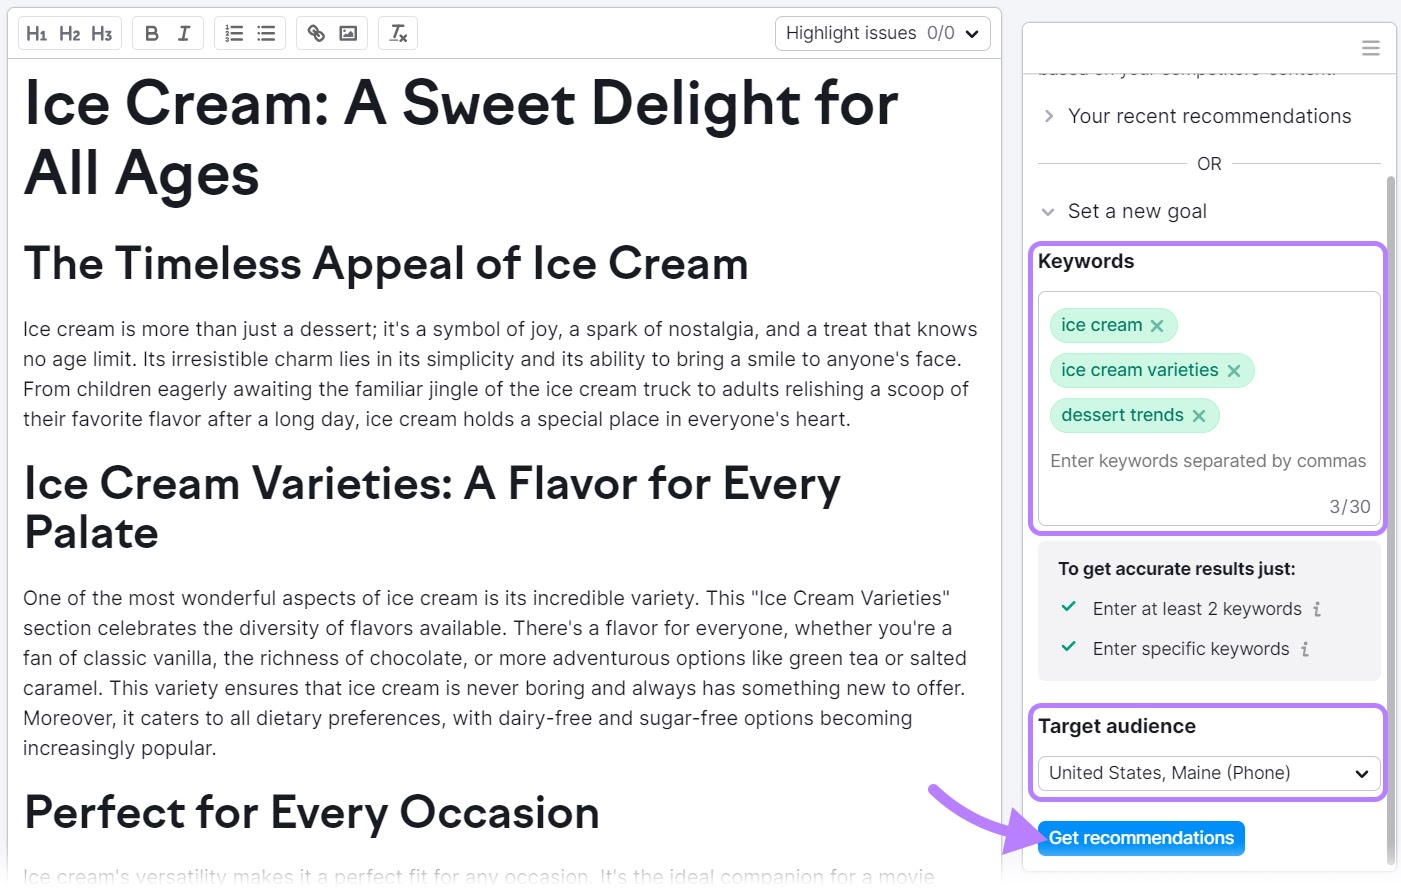
Type or paste your content in the text box. Then, add your target keyword(s) in the “Keywords” box under “Content recommendations” on the right-hand sidebar.
Select your target audience’s location and device specifications. Then, click the “Get recommendations” button.
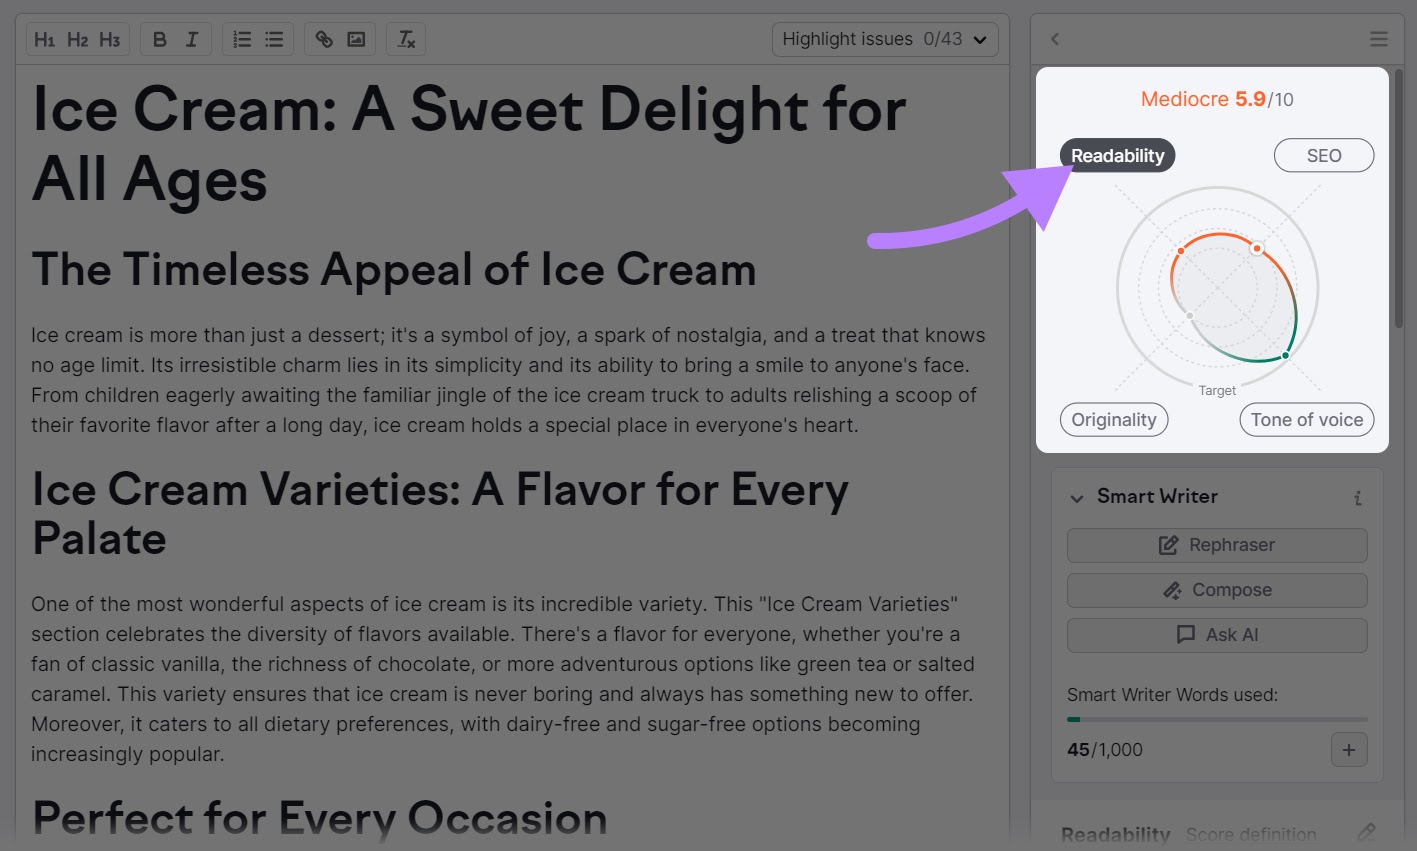
The SEO Writing Assistant will provide recommendations based on your content’s SEO, readability, and tone of voice. You can also use the originality check option to scan it for plagiarism.
Click on the “Readability” button to get recommendations.
The tool will give you title and word count recommendations. And it will point out various issues with your content.
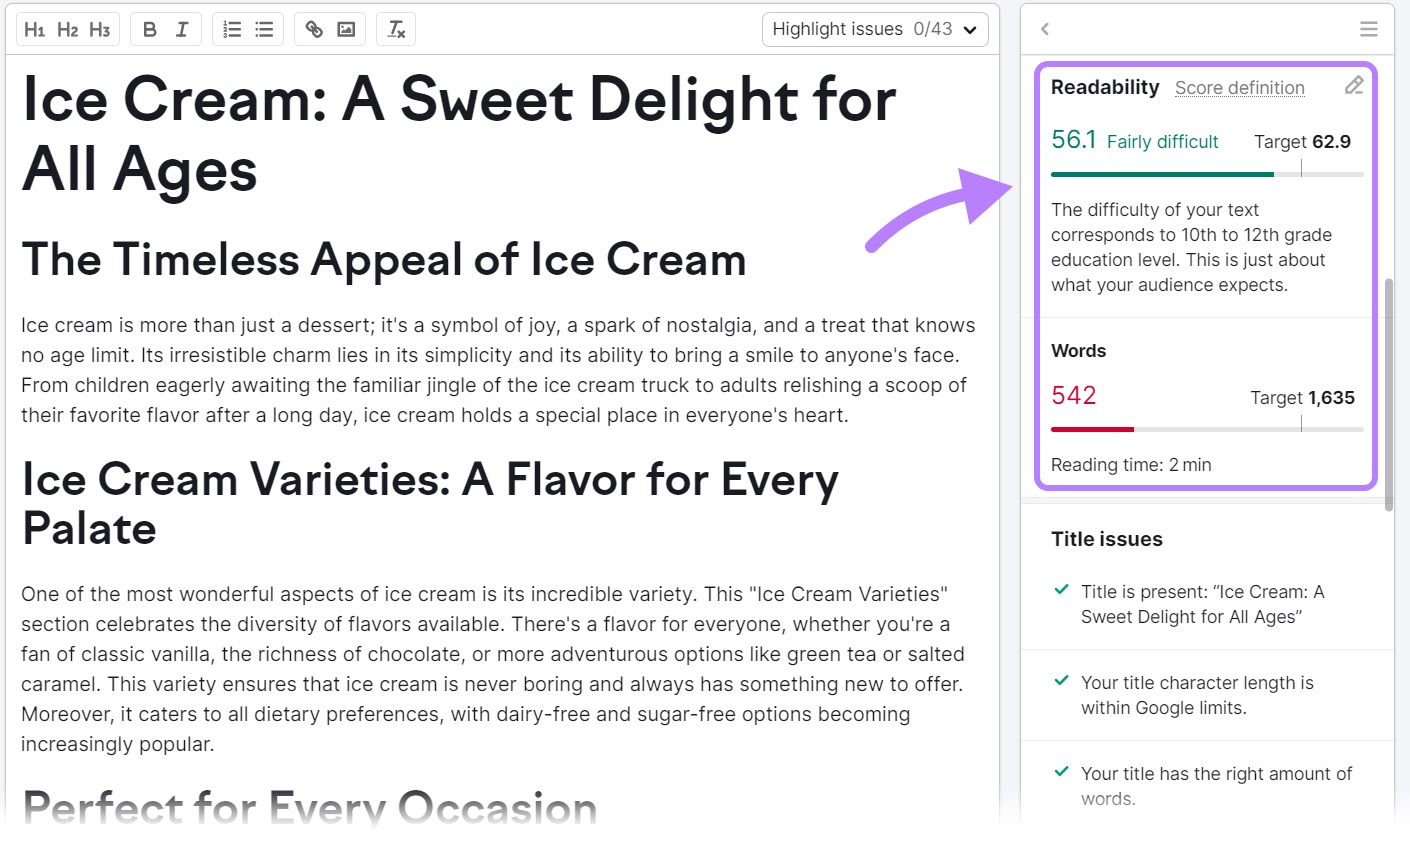
Use these recommendations to make your content easier to read and increase your time on page.
4. Improve Your Website’s User Experience (UX)
Improving how your website functions from a user’s perspective can encourage visitors to spend more time on your pages. Your website should be easy and intuitive to navigate, and overall it should provide an enjoyable experience.
If it’s hard to find key pages on your website, difficult to read your content due to lots of ads on the page, or if your pages take a long time to load, your users are unlikely to stick around for long.
Faster loading webpages don’t just provide a better user experience. They can also contribute to higher search engine rankings. As page speed is a confirmed Google ranking factor.
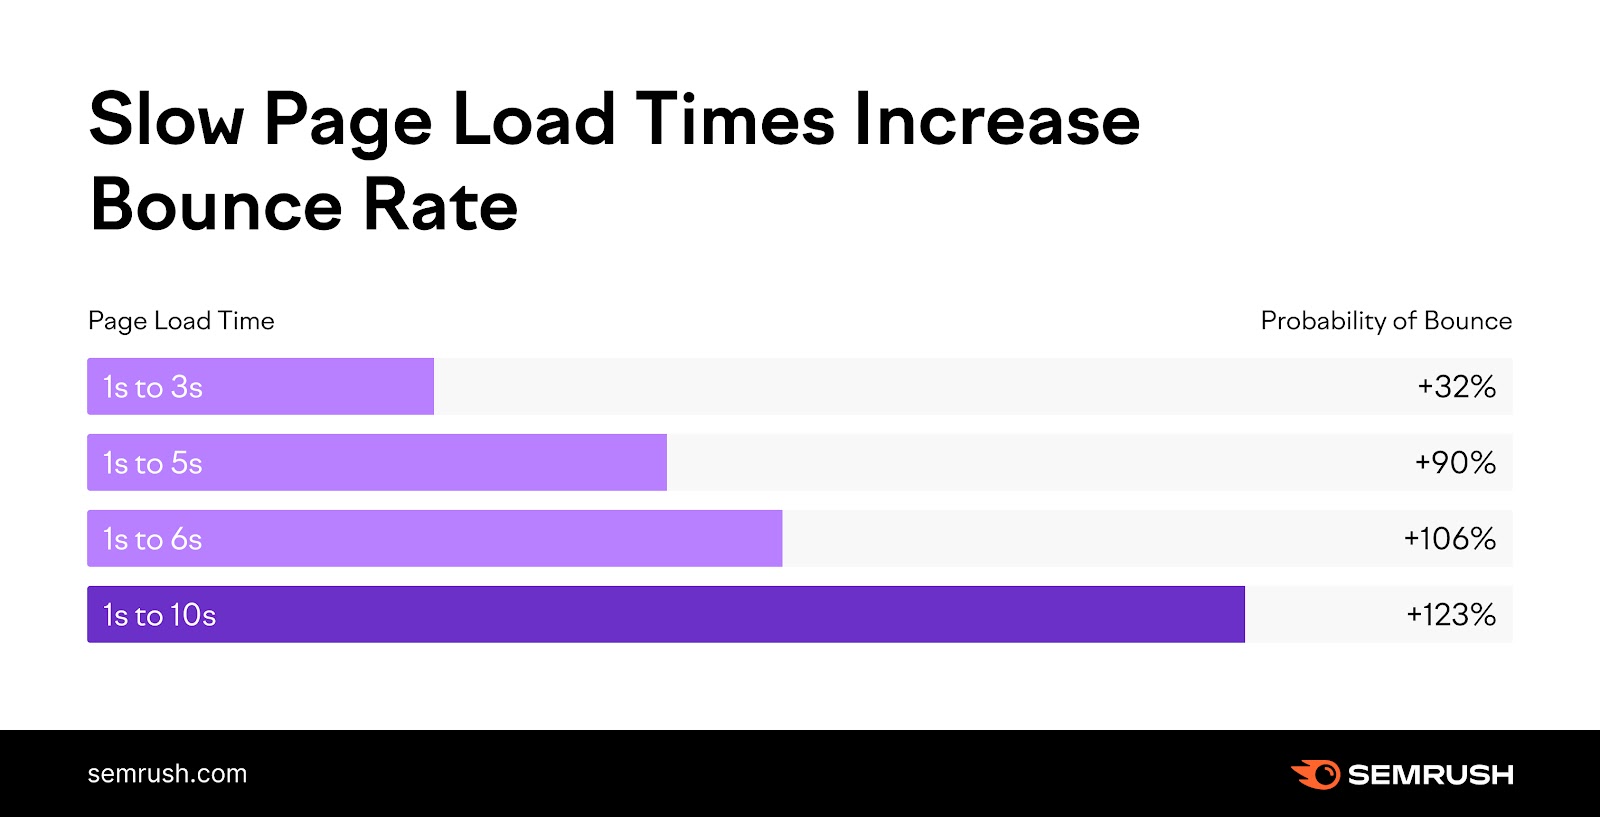
But even if people find your content, a slow-loading website can also significantly increase the likelihood of a visitor leaving your site without interacting with it (known as a bounce).
Google has found that the probability of a bounce increases almost threefold when site load times increase from 1-3 seconds to 1-5 seconds.
Follow these best practices to optimize your webpages’ load times:
- Compress your images: Large file sizes can slow down your website and take a while to load for the user—which could cause them to bounce
- Leverage minification: Remove unnecessary characters, whitespace, and other unnecessary elements from your code (if you use WordPress, there are plugins that can do this for you)
- Enable browser caching: This can allow repeat visitors to load your site faster, as their browser can store some of your site’s data
- Use a Content Delivery Network (CDN): CDNs can distribute your content across multiple servers worldwide, reducing the distance between the server and the user for faster load times
5. Build a Solid Internal Linking Strategy
Creating a network of internal links between your pages helps you guide visitors to other relevant content on your website. This can improve the overall average engagement time on your website, as users explore more pages and remain engaged for longer.
Internal links are hyperlinks that direct visitors to different pages on your website (like the one at the start of this sentence).
For example, if you have an article about basic SEO techniques, linking to a post on advanced SEO tactics might encourage them to explore more of your site. While also allowing them to build on what they’ve just learned in the first article.
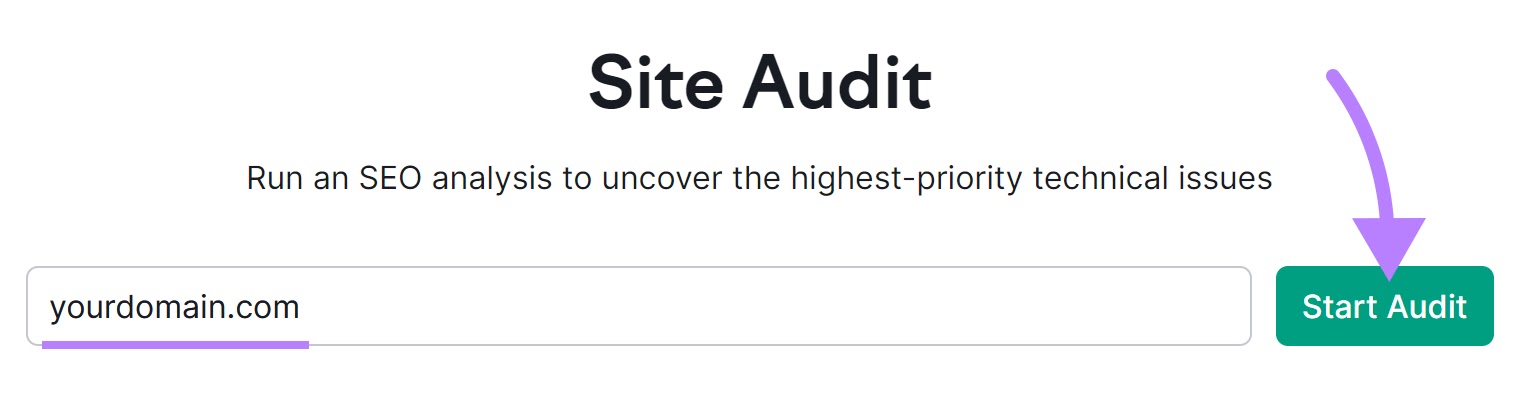
Use Semrush’s Site Audit tool to understand your website’s current internal linking structure. And see where you can make improvements.
Enter your domain name and hit the “Start Audit” button. If you’ve used the tool before, you’ll click “+ Create Project” instead.
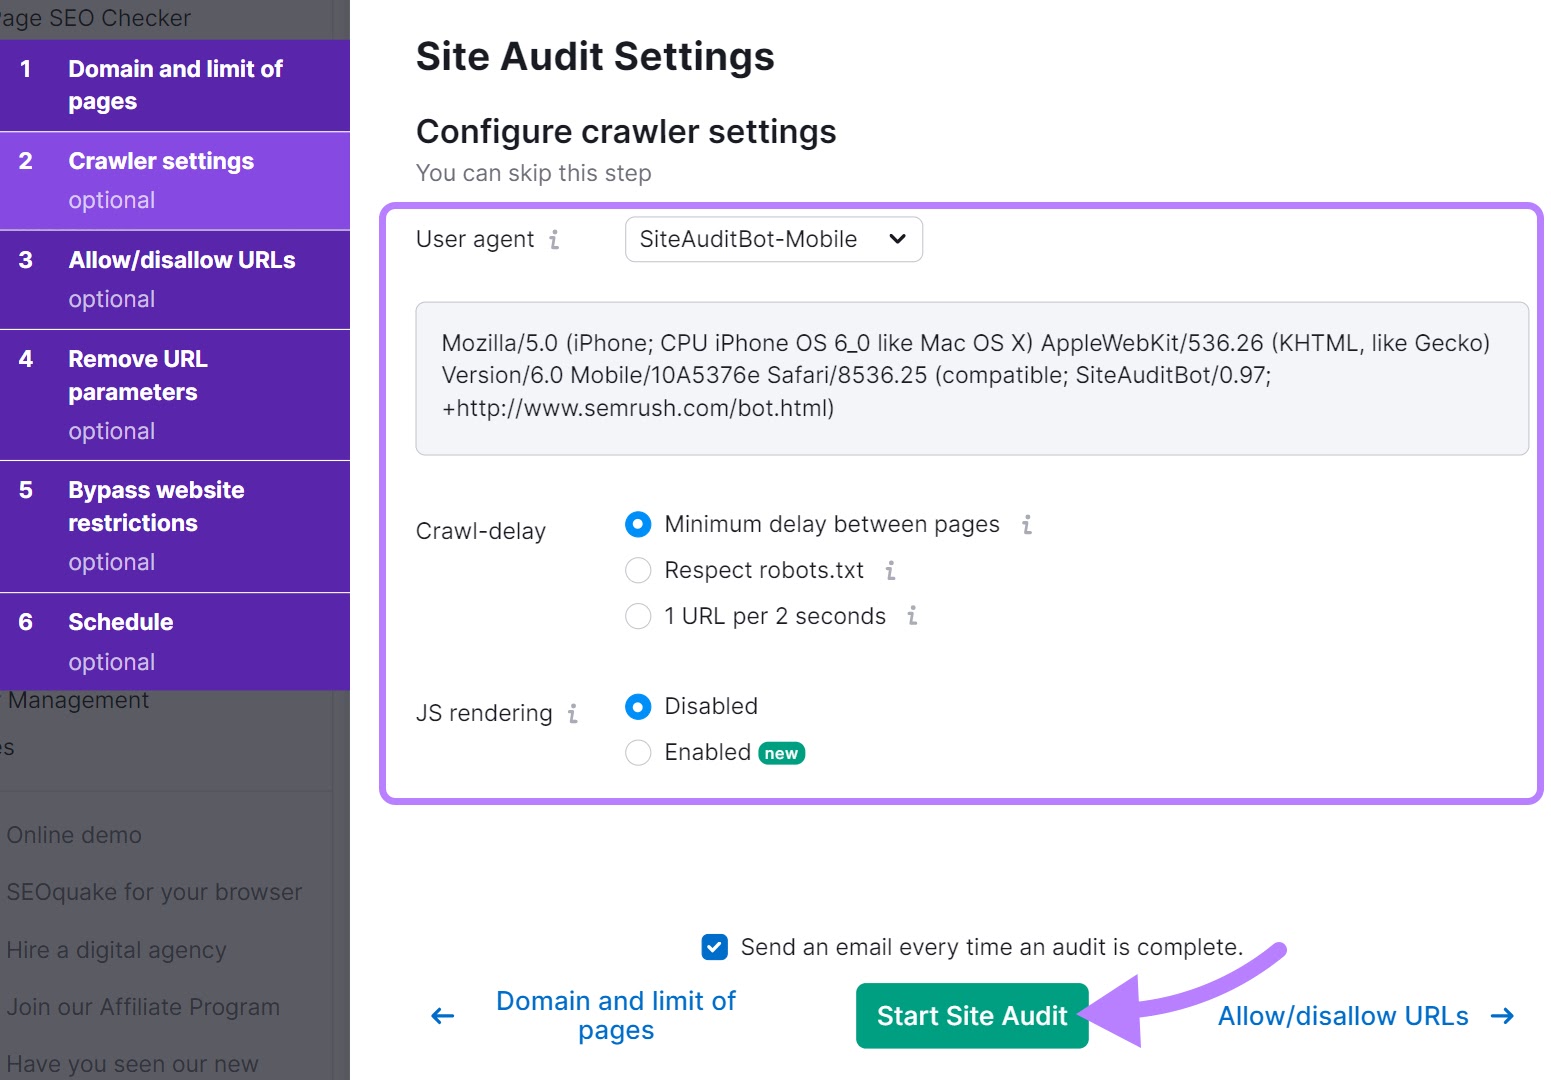
You’ll then need to configure various crawler settings, before clicking “Start Site Audit” when you’re ready to go.
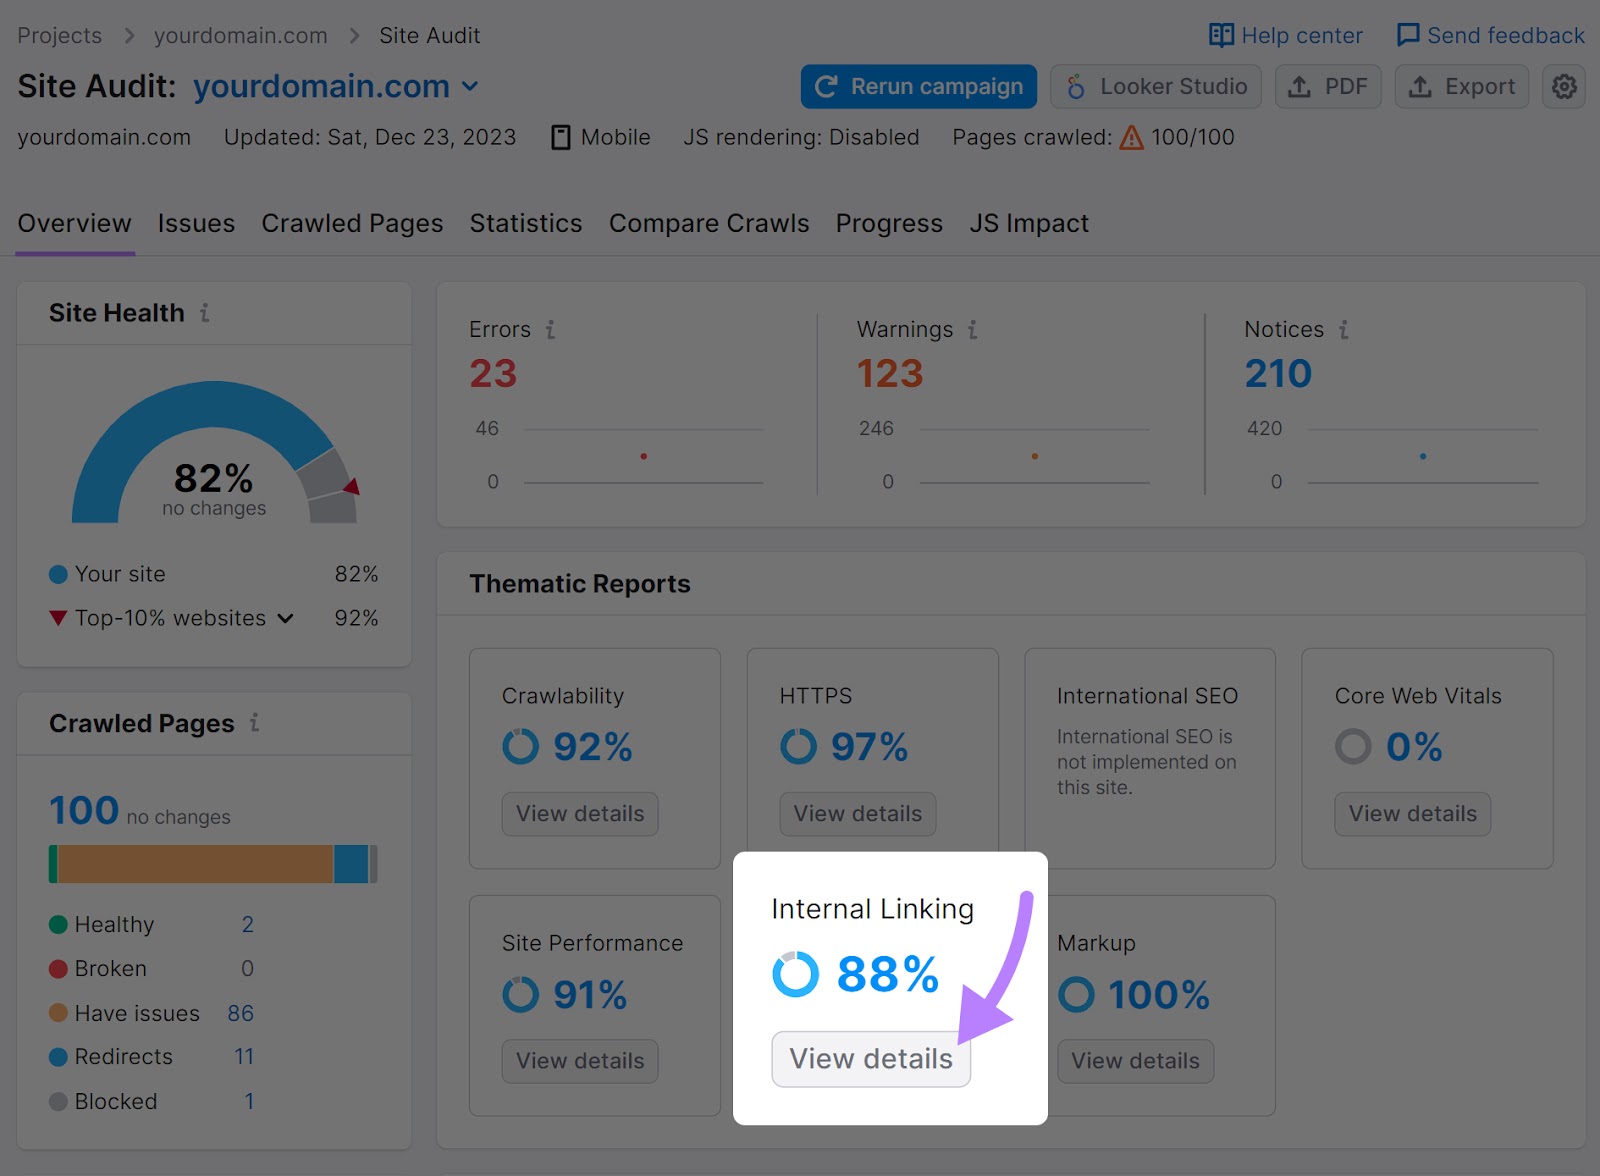
When the process is complete, you’ll see “Internal Linking” under “Thematic Reports.”
Click on “View details” to open the full report about your internal linking structure.
You’ll then see a page with insights about your website’s internal linking structure.
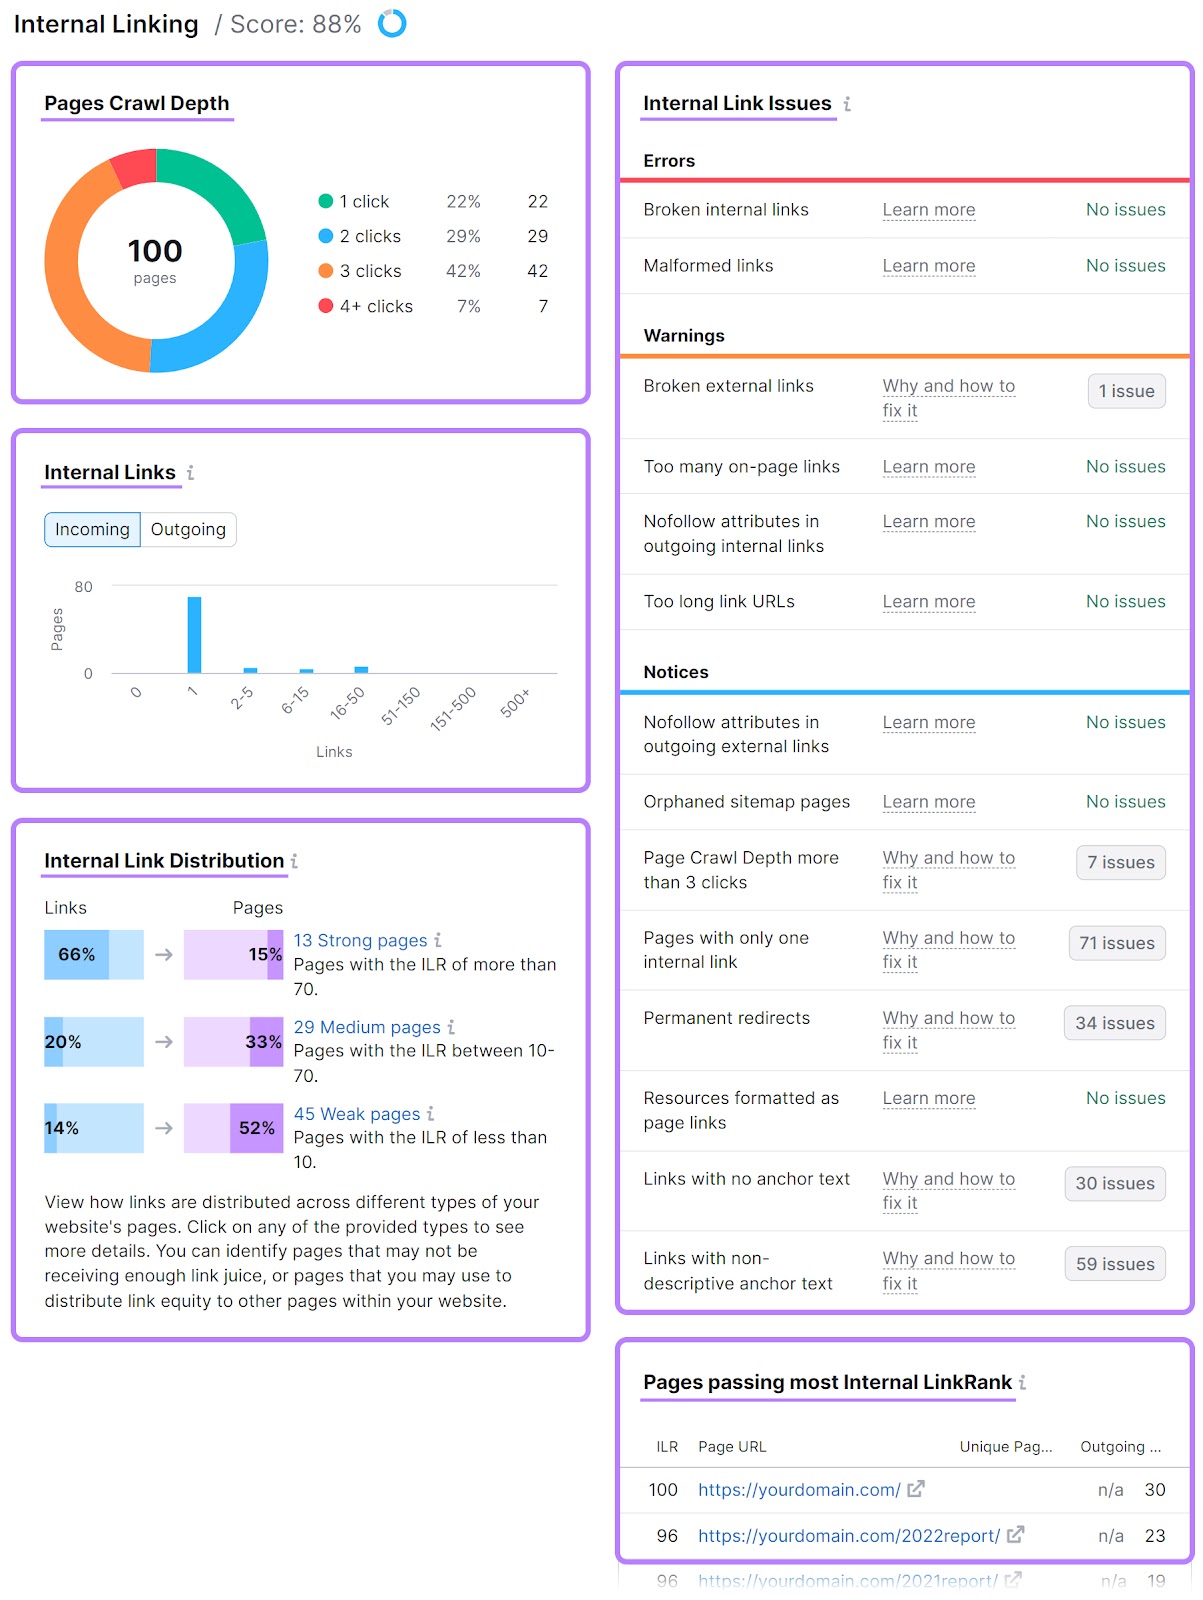
You’ll see the following insights:
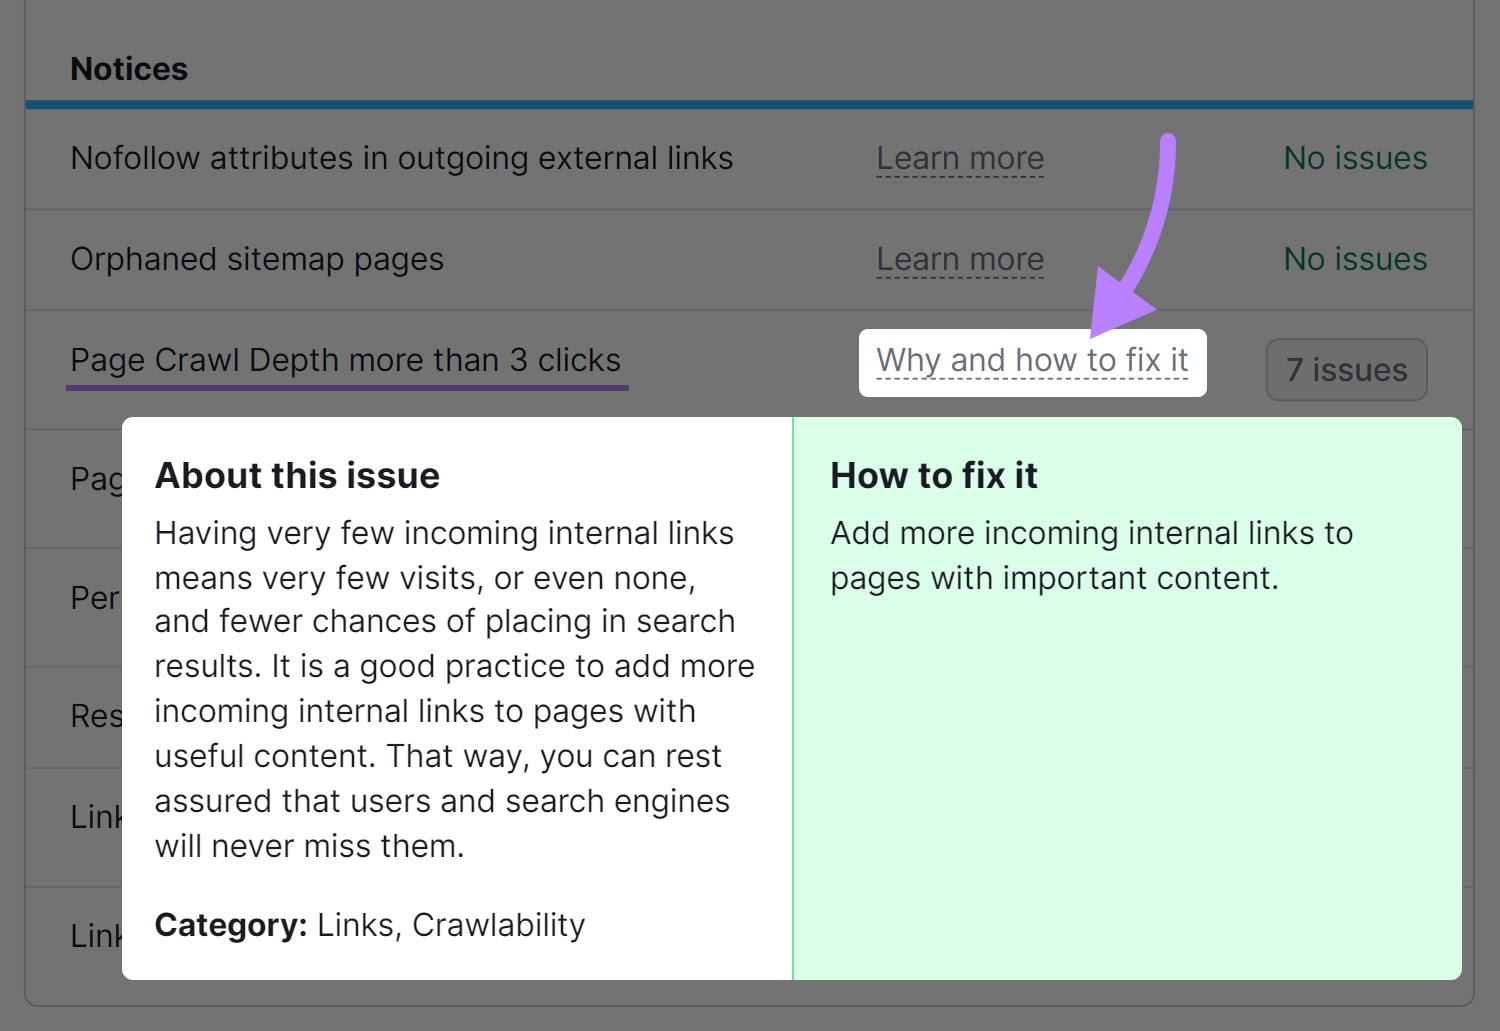
- Pages Crawl Depth: Measures the number of clicks needed to reach pages on your website. Keeping this as low as possible for your pages makes them easier to find—for both users and search engines.
- Internal Links: Displays the distribution of internal links on your website. You can click each part of the bar graph to see which pages have the corresponding number of internal links pointing to them.
- Internal Link Distribution: Provides more detail on the distribution of your internal links. Use this to understand which pages you might want to add more internal links to, and which ones you may want to link out from.
- Internal Link Issues: Lists problems with your website’s internal link structure. You’ll also be able to click “Why and how to fix it” to learn what you can do to solve each issue.
- Pages Passing Most Internal LinkRank: Shows your most important pages based on internal link authority. You can place relevant internal links on these pages to better distribute link authority throughout your site.
Click on “Why and how to fix it” beside an issue to view suggestions on how to fix it.
Analyzing your site’s internal linking structure and fixing any issues the Site Audit tool uncovers can help you keep your readers engaged for longer.
6. Optimize Your Website for Mobile
A mobile-optimized website provides a better user experience, which we know is important for keeping readers on the page. But this is increasingly important as users become more likely to access your website on a mobile device.
Mobile devices generated nearly 55% of global website traffic in the fourth quarter of 2023. So, if your website is hard to use on mobile, your readers are unlikely to stick around. Reducing your average time on page.
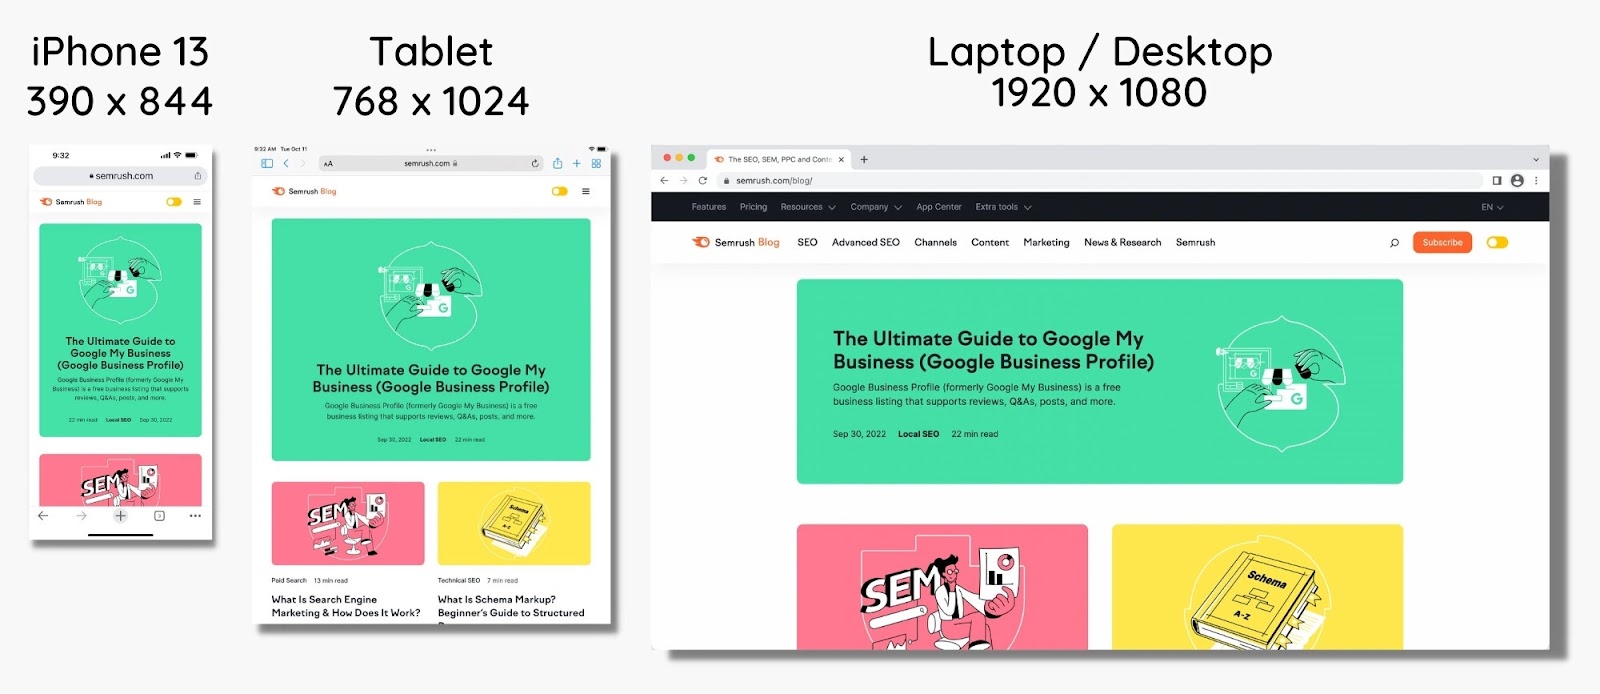
Optimize your website for mobile by implementing responsive design, which adapts to the screen size and orientation of the user’s device. This ensures your website will function properly whether the visitor is using a smartphone, tablet, or desktop.
Adopt these best practices to optimize your website for mobile devices:
- Have a simple, user-friendly navigation menu
- Ensure that design elements like buttons and links are easy to tap with a finger, not just a mouse cursor
- Ensure your site loads quickly to reduce bounce rates
- Make sure your text size is readable on mobile without zooming in
- Use short paragraphs, not walls of text
- Regularly test your website on various mobile devices to ensure compatibility and a smooth user experience
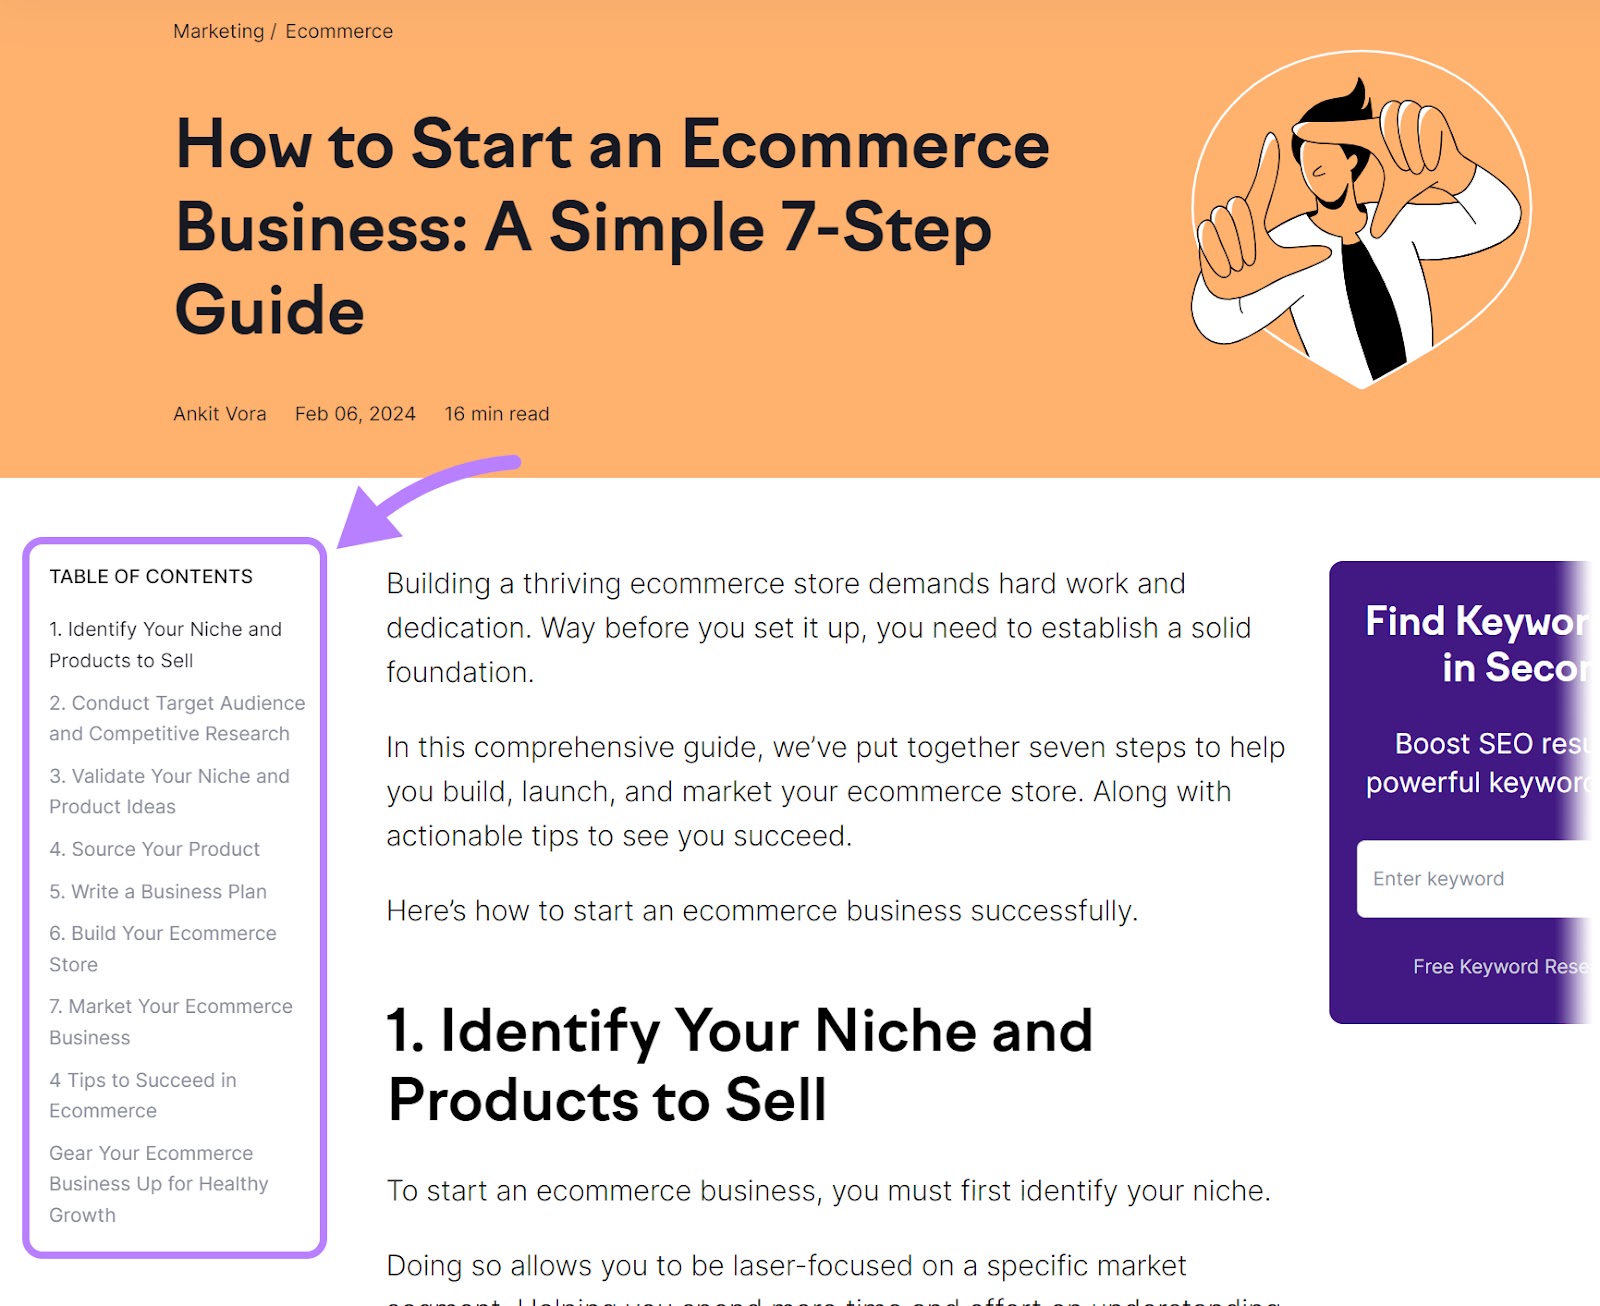
7. Add a Table of Contents
A table of contents provides a roadmap for visitors, allowing them to quickly locate and jump to the information they’re most interested in. Helping to engage them from the moment they reach your content.
Imagine landing on a webpage with a lengthy, detailed article. Without a table of contents, a visitor might feel overwhelmed by the sheer volume of text and struggle to find the specific information they need. This can lead to frustration and a higher likelihood of them leaving the page.
Follow these tips to implement a table of contents that helps you improve your average engagement time in Google Analytics 4:
- Place the table of contents near the beginning of your page
- Make sure each item in the table of contents is a clickable link that takes the reader directly to the corresponding section
- Keep each entry in the table of contents concise yet descriptive enough to give a clear idea of what the section covers
- Ensure the table of contents is easily navigable on desktop and mobile devices
- Consider making it “sticky” so the reader can access it no matter how far they are down the page
Optimize for a Higher Average Engagement Time with Semrush
Keeping your audience engaged for longer can help you meet key business goals.
Whether it’s increasing display ad revenue, getting more sales, or reaching more qualified leads, making your content more engaging can help you grow your business.
Semrush’s suite of tools can help you achieve these goals through better content optimization. From Topic Research to help you answer all your audience’s questions, to the SEO Writing Assistant to make your content easier to read.
Sign up for a free trial with Semrush to optimize your content, make it more engaging, and improve your average time on page metrics.
Source link : Semrush.com