
Knowing how your target market uses mobile or desktop devices helps you plan your marketing strategy. And reach more of your intended audience.
Let’s compare mobile vs. desktop usage, the advantages and disadvantages of each, and actionable tips you can use for your business.
Mobile vs. Desktop Usage Statistics for 2024
To show the differences between mobile vs. desktop users, we looked at key metrics that define website traffic:
- Visits: The number of times users land on your website, which indicates the overall traffic volume to your site
- Unique visitors: The number of individual users visiting your website within a specific period. It can provide insights into the size of your audience, helping you understand your website’s reach.
- Average pages per visit: The average number of pages a user views during a single site visit. It indicates how much users engage with your website.
- Average visit duration: The average amount of time users spend on your website during a single visit. It can indicate user engagement, as longer durations hint at more meaningful interactions.
- Bounce rate: The percentage of users who land on your webpage and leave without engaging with other pages or elements. A lower rate suggests users find your content helpful.
And for the data shown below, we analyzed the top 100 most visited websites in the U.S. based on data from Semrush’s Traffic Analytics tool.
(Later, we’ll cover how you can find your target market’s device usage.)
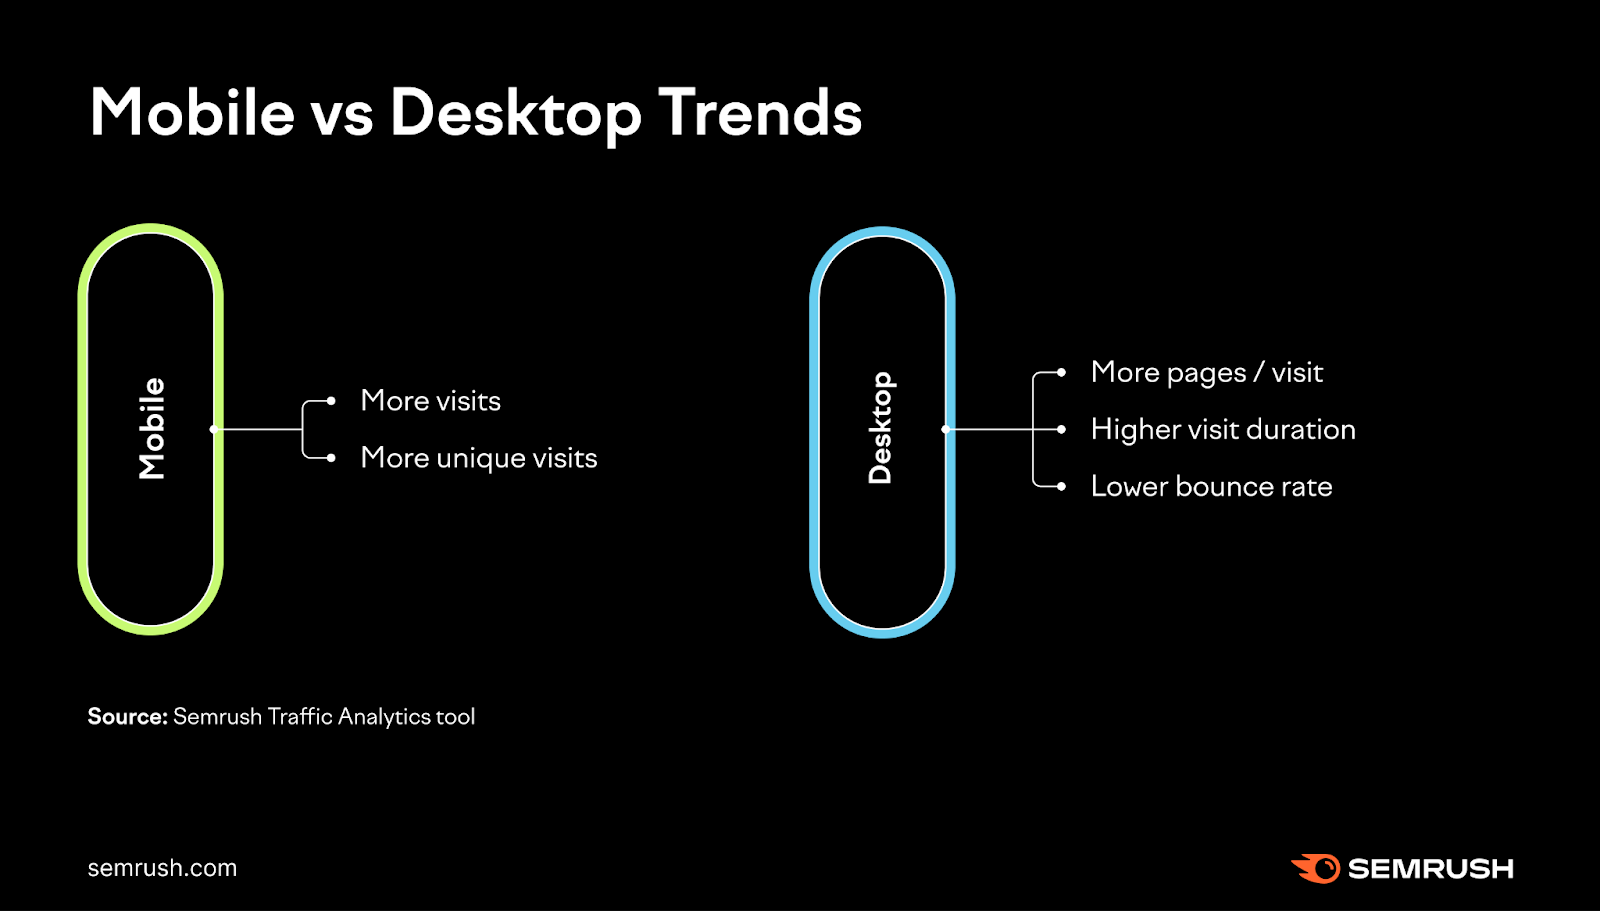
The chart below shows mobile devices receive more website visits and unique website visitors than desktop.
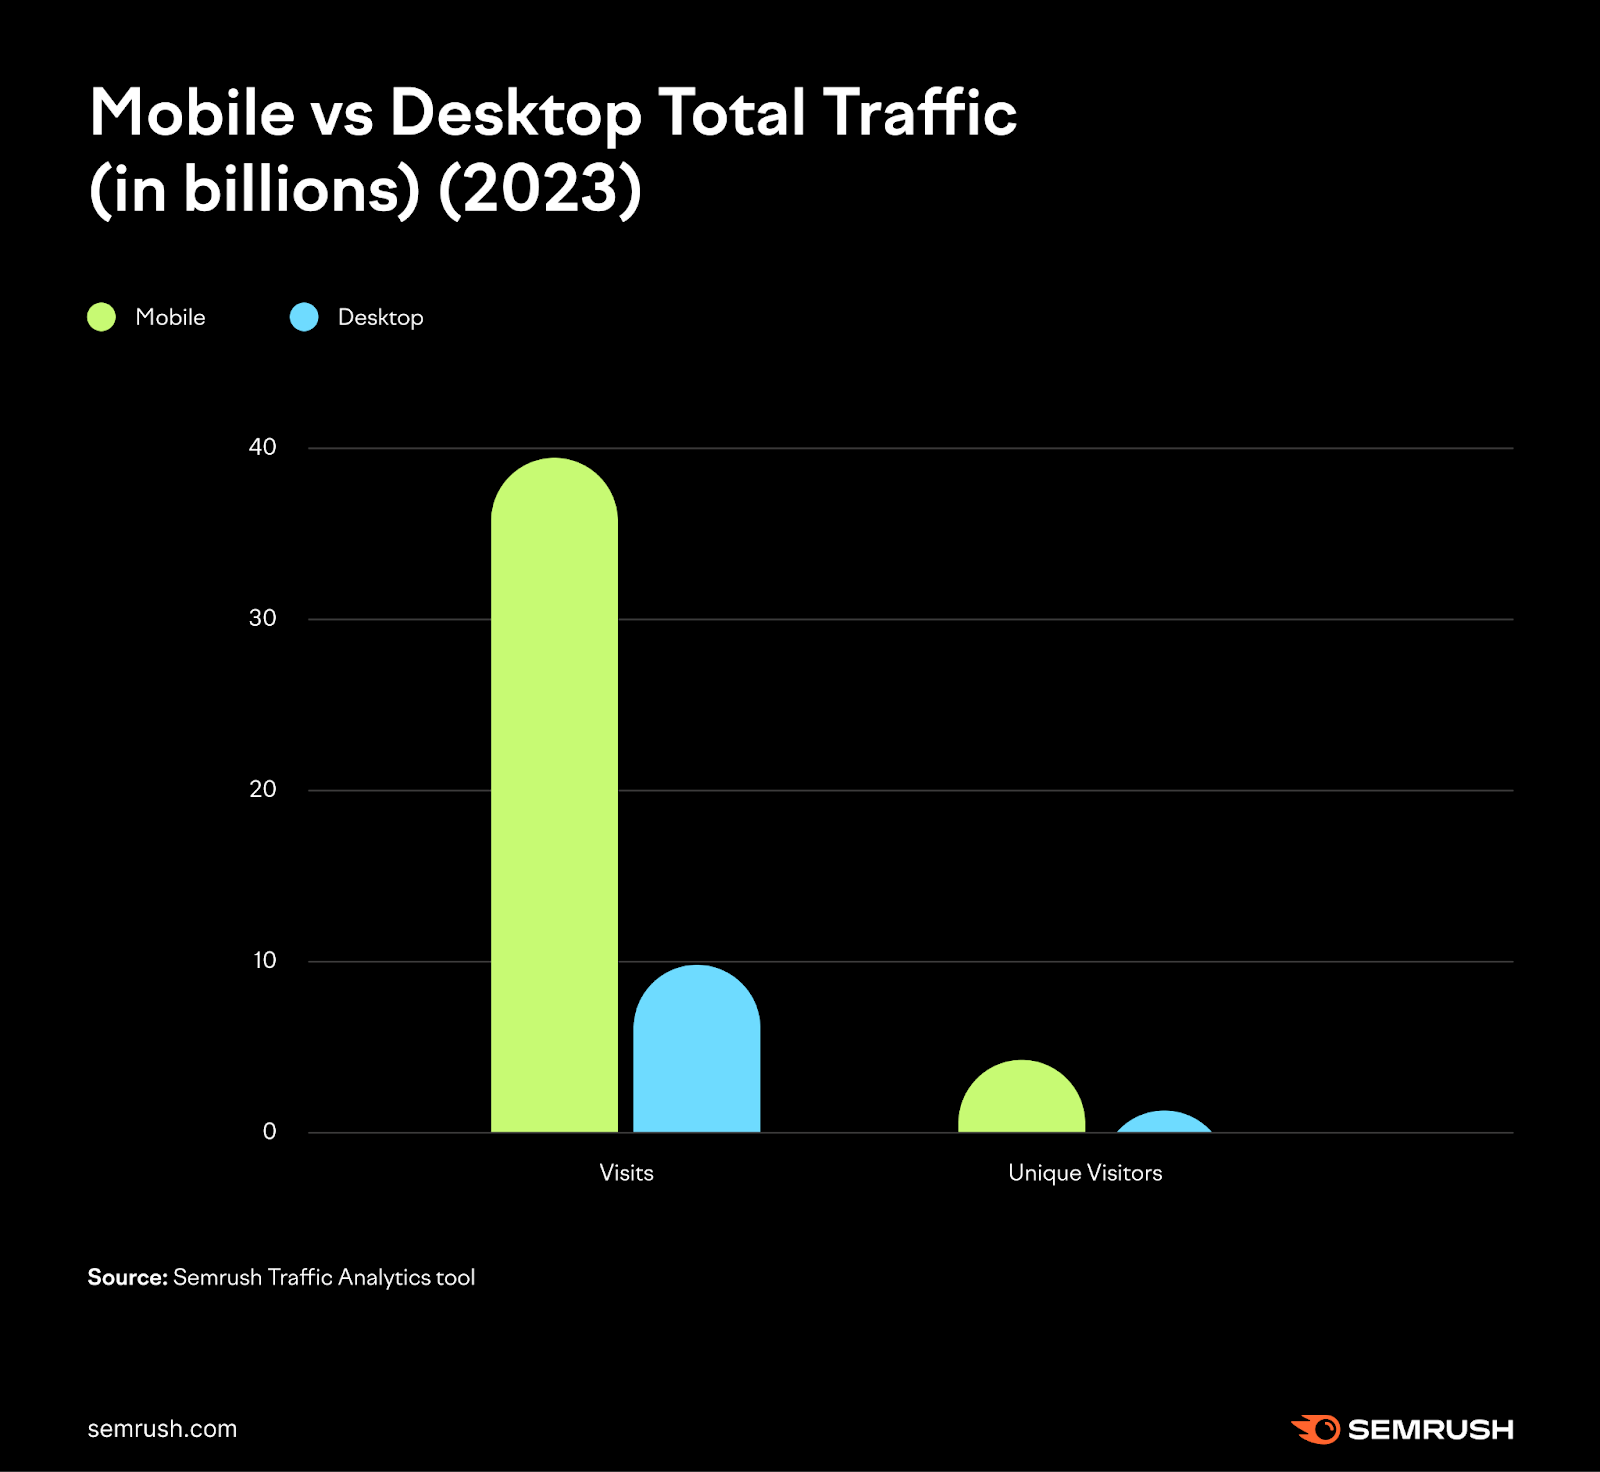
However, don’t assume this trend indicates a preference for mobile without further context or direct user feedback.
Several factors might drive this trend, such as the convenience of mobile devices, changes in user behavior, or the growing optimization of websites for mobile browsing.
According to the data below, desktop users typically visit more pages and spend more time per visit than mobile users.
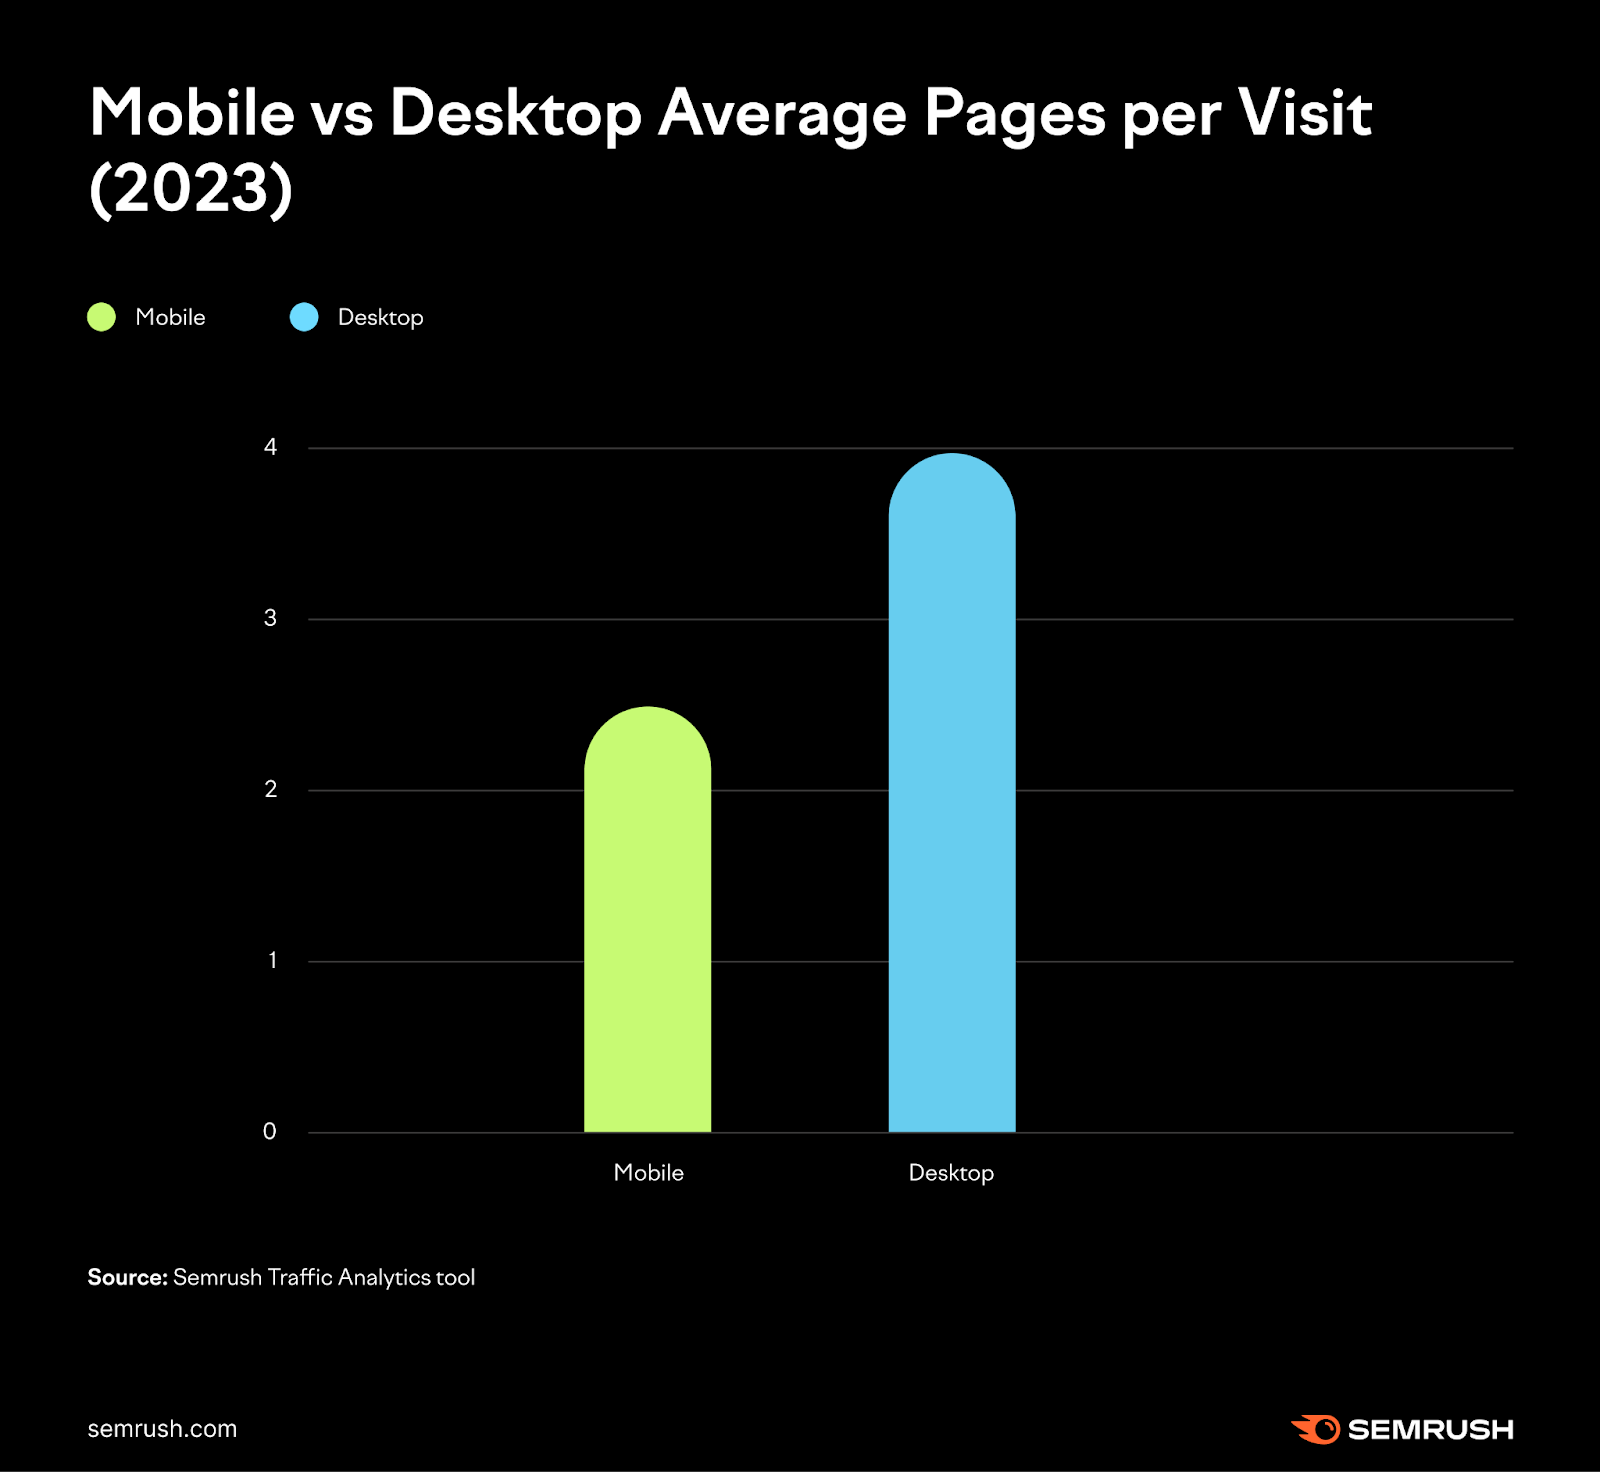
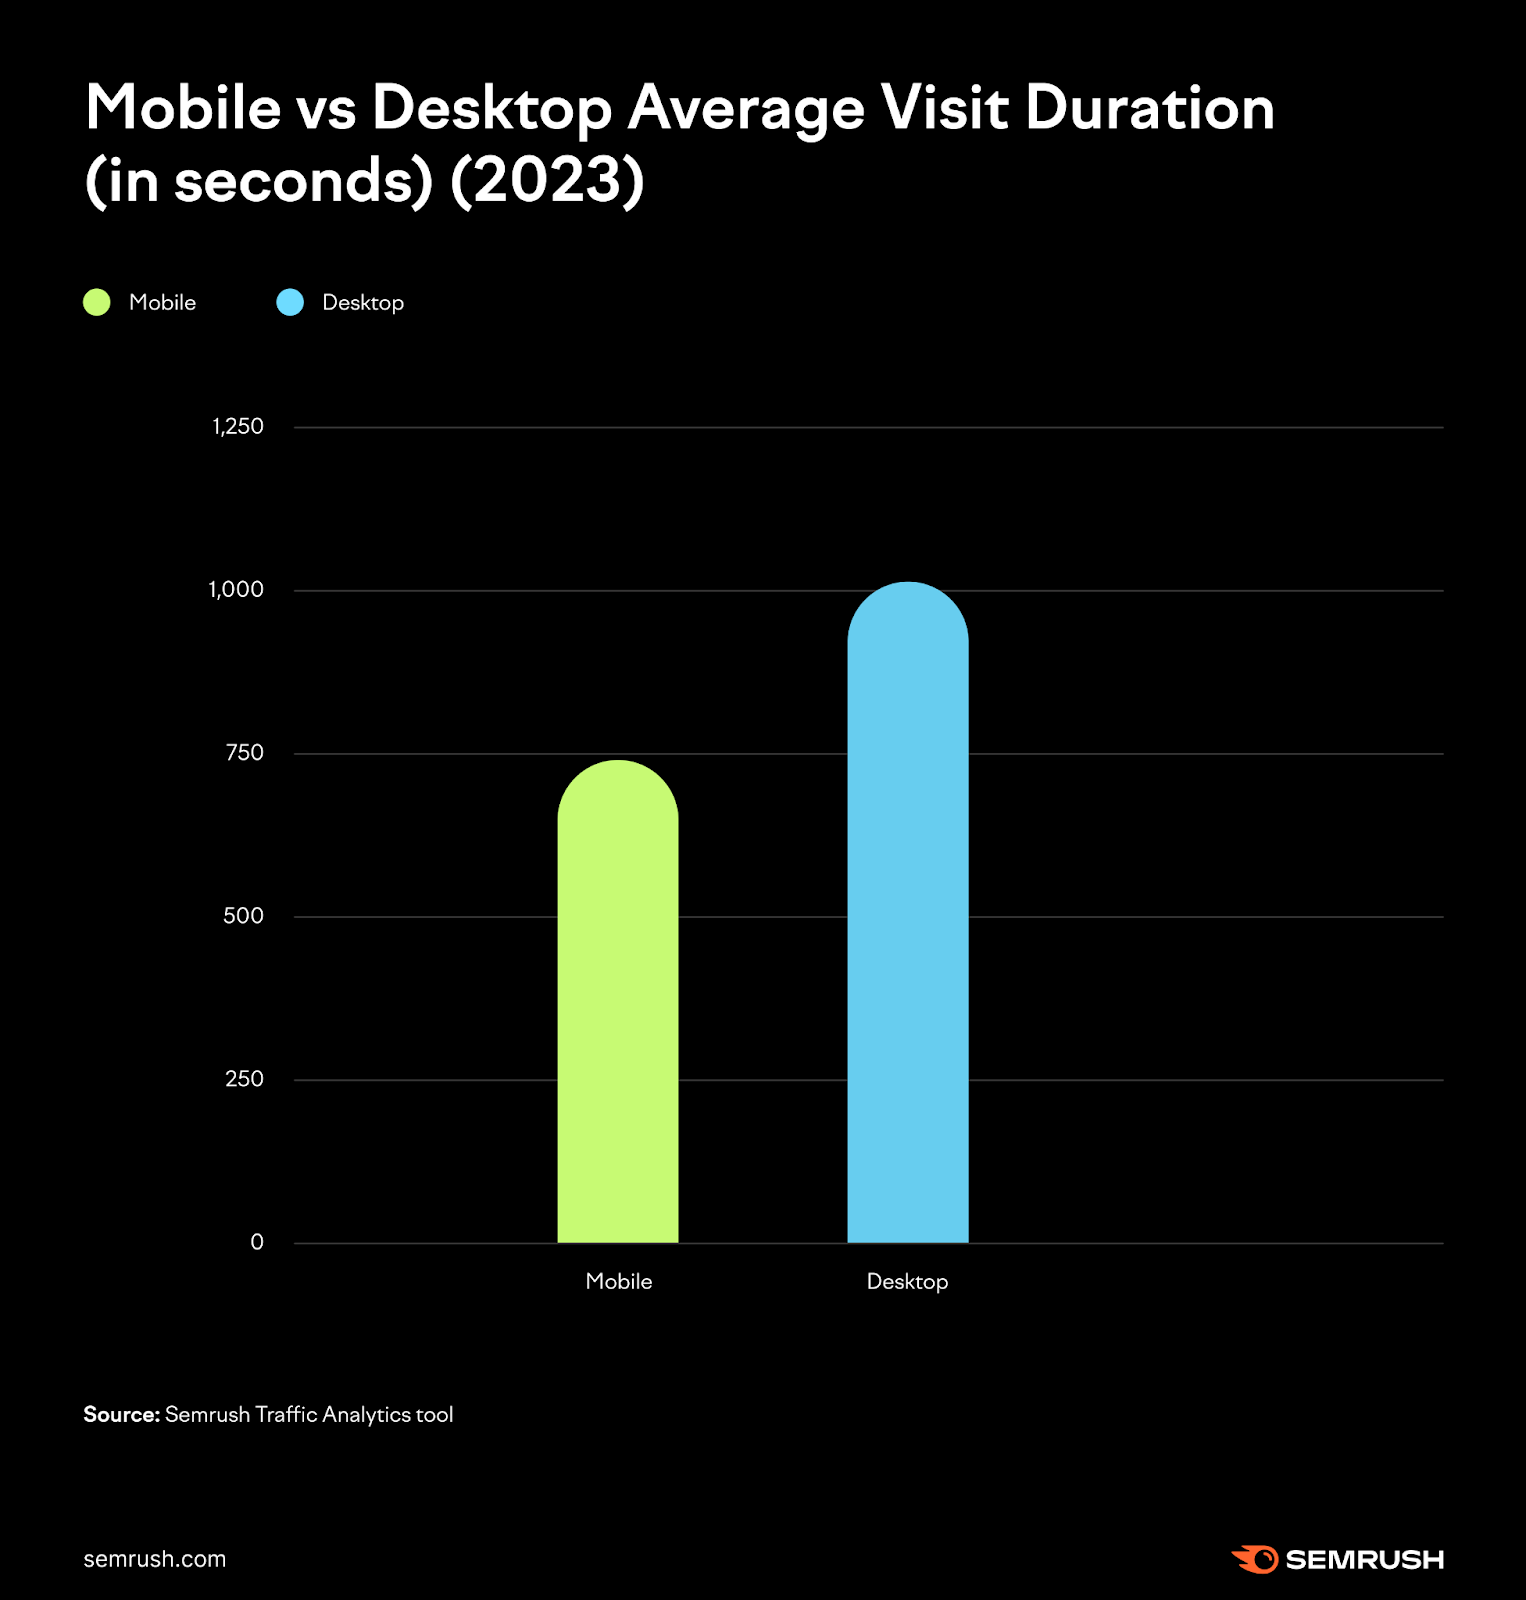
Although these metrics imply engagement, they don’t entirely reveal the content’s quality. Various factors significantly affect these metrics, including content type, website design, and user intent.
The lower bounce rate on desktop suggests that these users are more likely to stick around on a website.
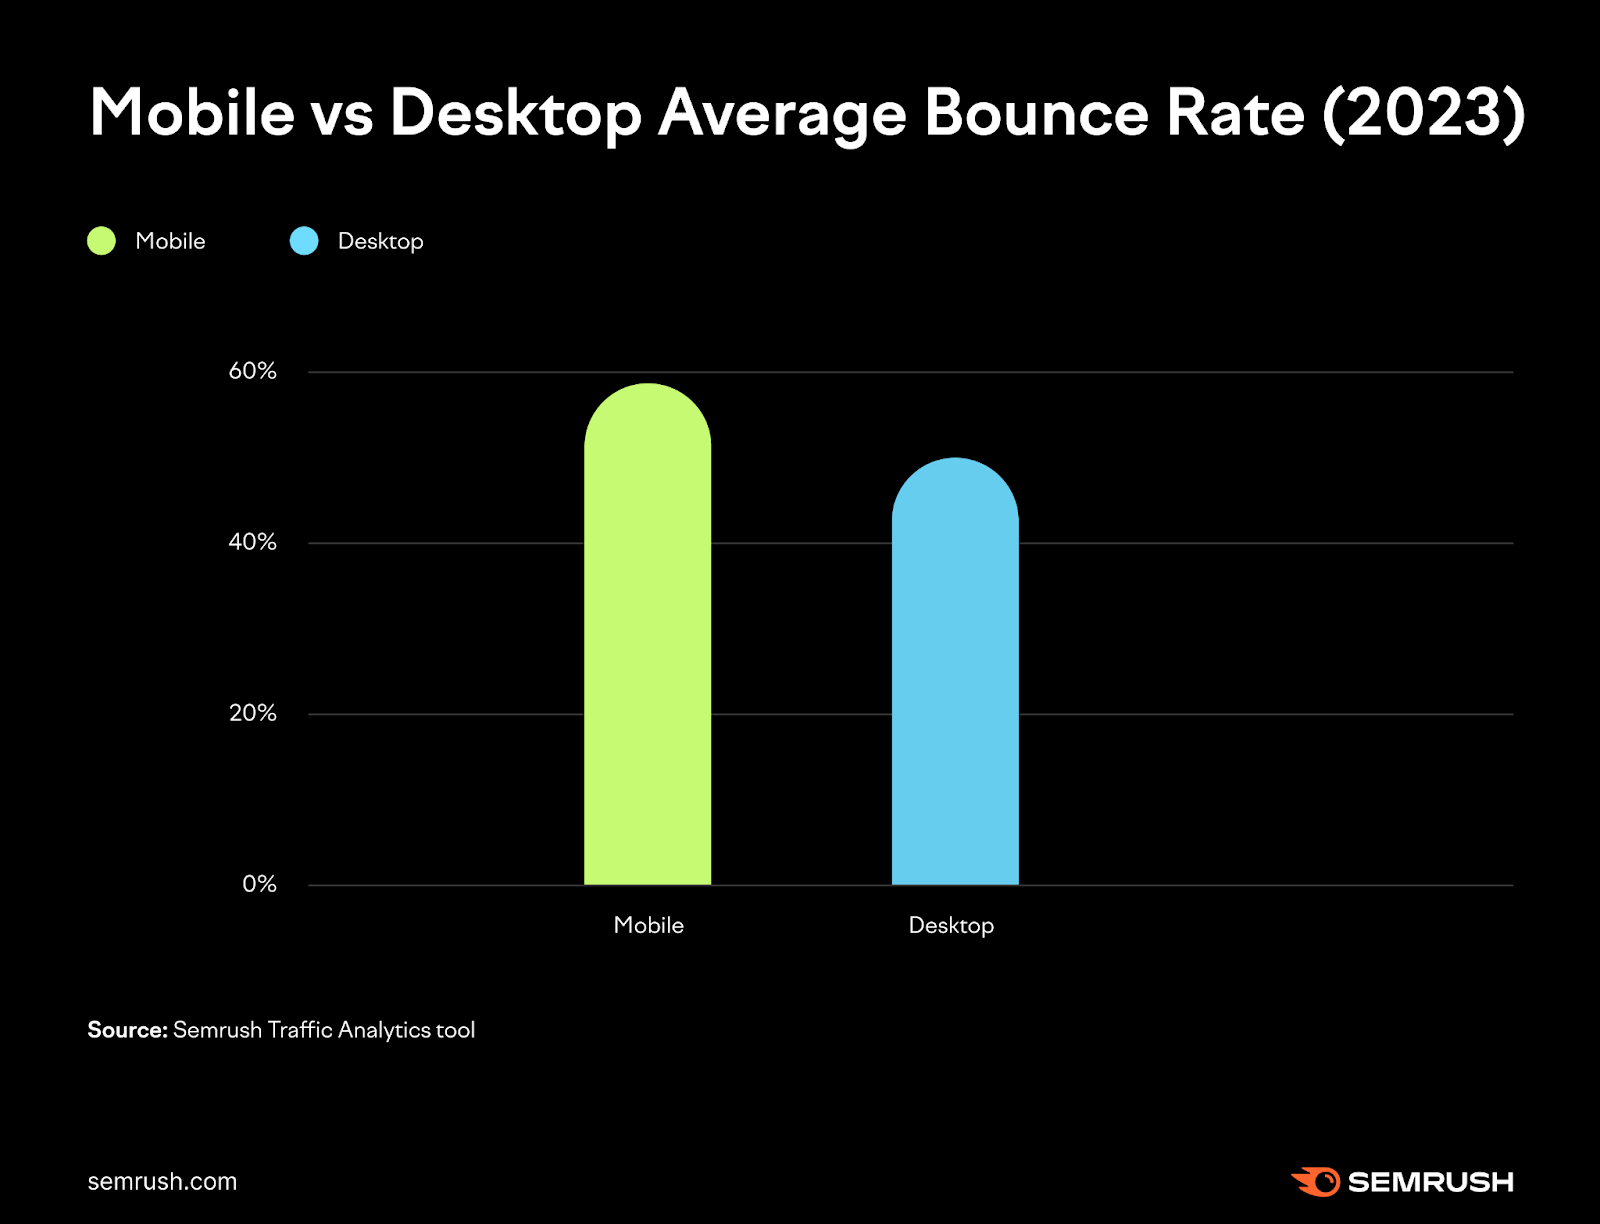
This might tell us that desktop users prefer more in-depth content, like detailed guides. And a lower bounce rate on desktop for sectors like ecommerce might signal better conversion opportunities.
You can use this data to optimize your sales funnel for desktop users in several ways, such as personalized product recommendations and targeted marketing.
Enhance user engagement by tailoring your content and design for specific devices.
Desktop vs. Mobile Historical Usage Statistics
Let’s look at the mobile vs. desktop statistics for the past few years to understand how user behavior and traffic trends have evolved.
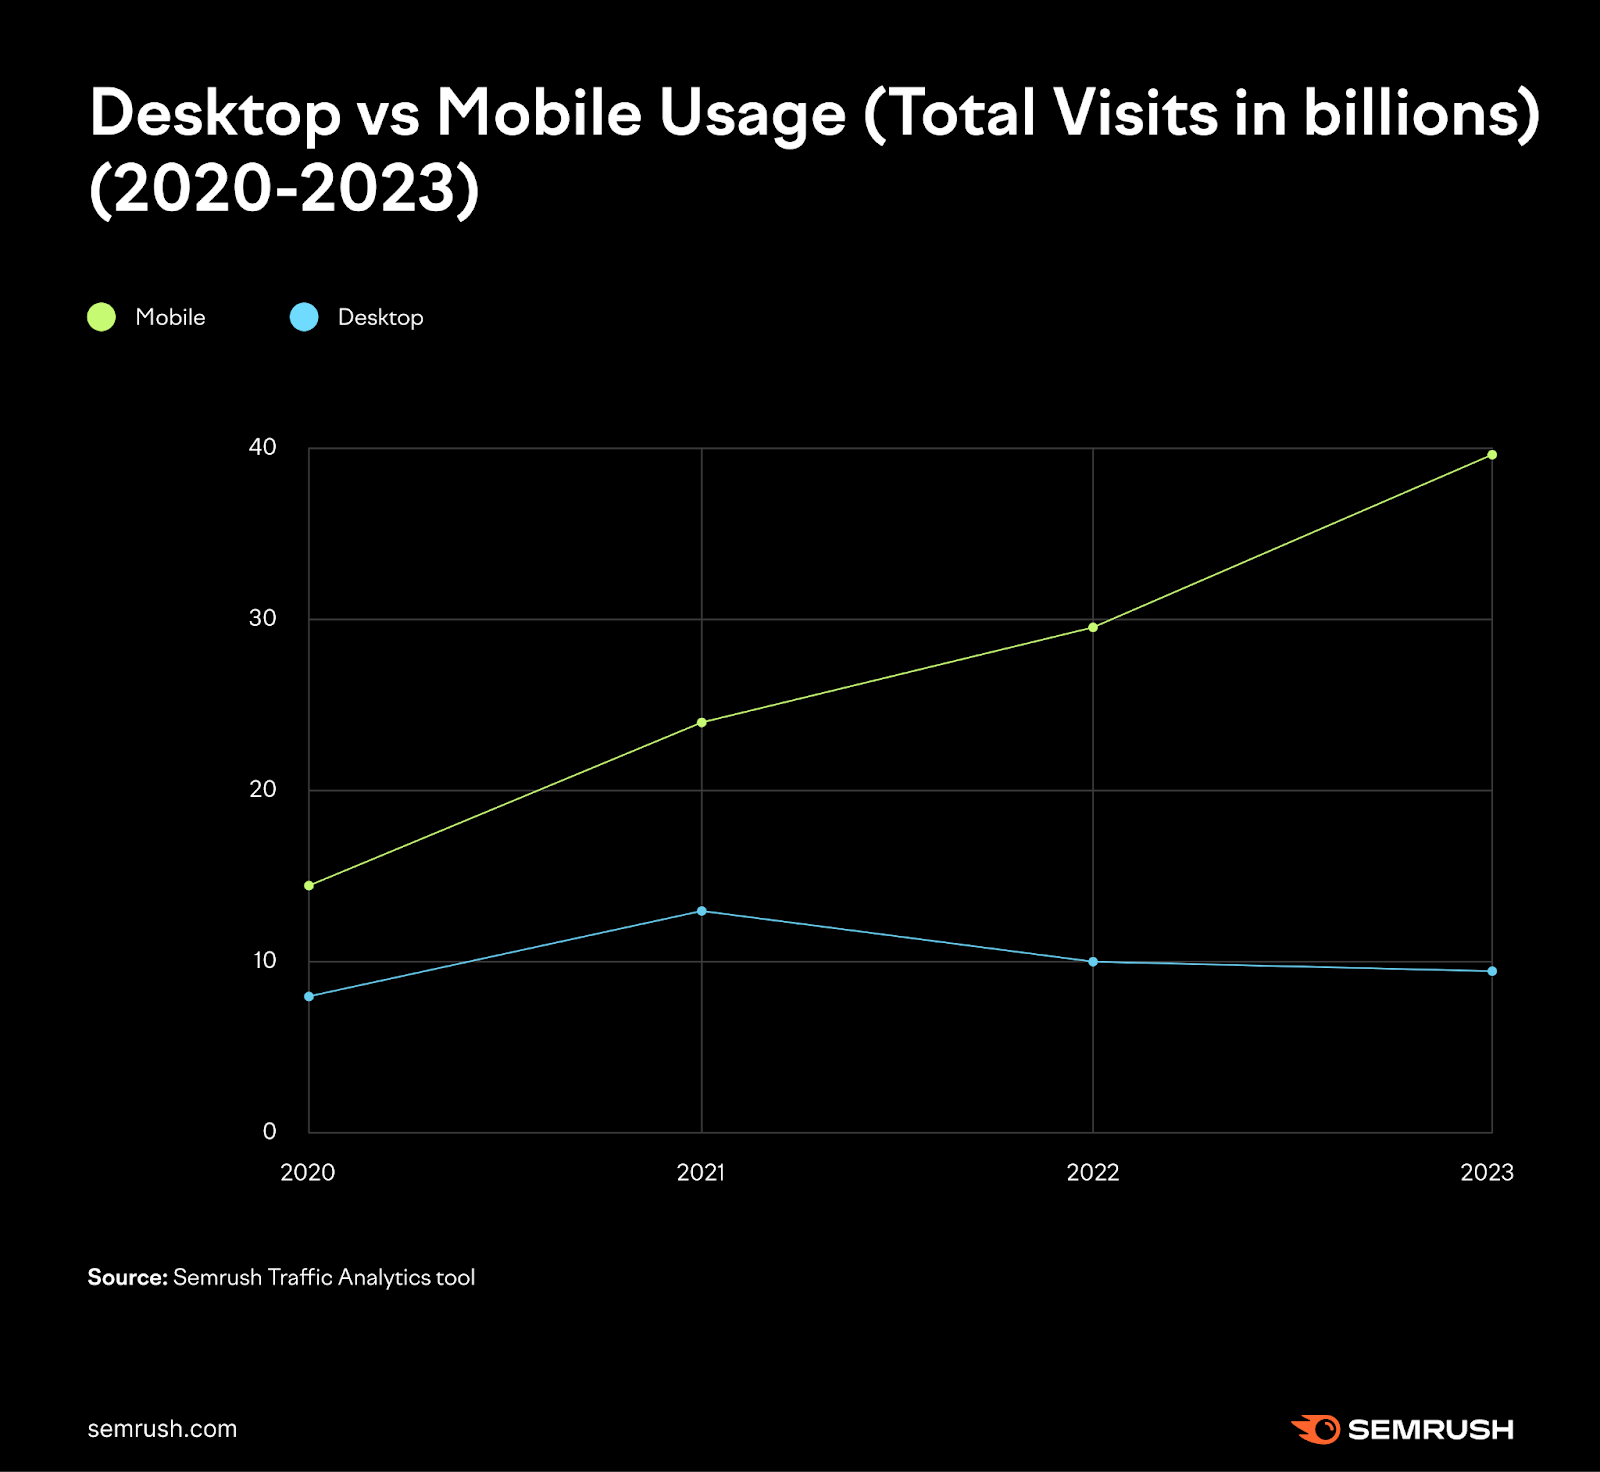
2020
- Visits: Mobile visits were 81% higher than desktop
- Unique visitors: Visitors on mobile devices accounted for 155% more unique visits than those on desktop
- Average pages per visit: Visitors checked out 33% more pages per visit via desktop than mobile
- Average visit duration: Desktop usage showed 79% longer visit duration than mobile
- Bounce rate: Desktop usage had a lower bounce rate at 49.05% than mobile usage at 53.51%
2021
- Visits: Mobile usage recorded 81% more visits than desktop
- Unique visitors: Visitors on mobile devices accounted for 123% more unique visits than those on desktops
- Average pages per visit: Visitors checked out 25% fewer pages per visit via mobile than desktop
- Average visit duration: Visitors spent 77.8% longer per visit via desktop than mobile
- Bounce rate: Mobile usage had a higher bounce rate at 53.75% than desktop usage at 51.76%
2022
- Visits: 203% more visits on mobile compared to desktop
- Unique visitors: Visitors on mobile devices accounted for 169% more unique visits than those on desktops
- Average pages per visit: Visitors checked out 100% more pages per visit via desktop than mobile
- Average visit duration: Visitors spent 53% longer per visit via desktop than mobile
- Bounce rate: Mobile usage had a higher bounce rate at 58.48% than desktop usage at 49.73%
2023
- Visits: 313% more visits on mobile compared to desktop
- Unique visitors: Visitors on mobile devices accounted for 233% more unique visits than those on desktops
- Average pages per visit: Visitors checked out 100% more pages per visit via desktop than mobile
- Average visit duration: Visitors spent 37.7% longer per visit via desktop than mobile
- Bounce rate: Mobile usage had a higher bounce rate at 59.74% than desktop usage at 49.80%
The consistent increase in mobile visits and unique mobile visitors highlights the growing reliance on mobile devices.
This data emphasizes the need to prioritize mobile-friendly designs and strategies. (Which we’ll touch on later.)
The data also suggests that although mobile may be popular for quick browsing, desktop users prefer more in-depth engagement.
But let’s dig into the metrics that signal user engagement.
User Engagement Signals
Average Pages per Visit: Mobile vs. Desktop
In 2023, mobile users visited an average of about three pages per session.
The average pages per visit on desktop ranged from nearly four to seven, indicating that desktop users tend to look at more webpages.
Average Time on Site: Mobile vs. Desktop
Mobile users generally spend less time on websites, with an average visit duration between 704 and 775 seconds. Desktop users spent between 996 and 1,918 seconds per session.
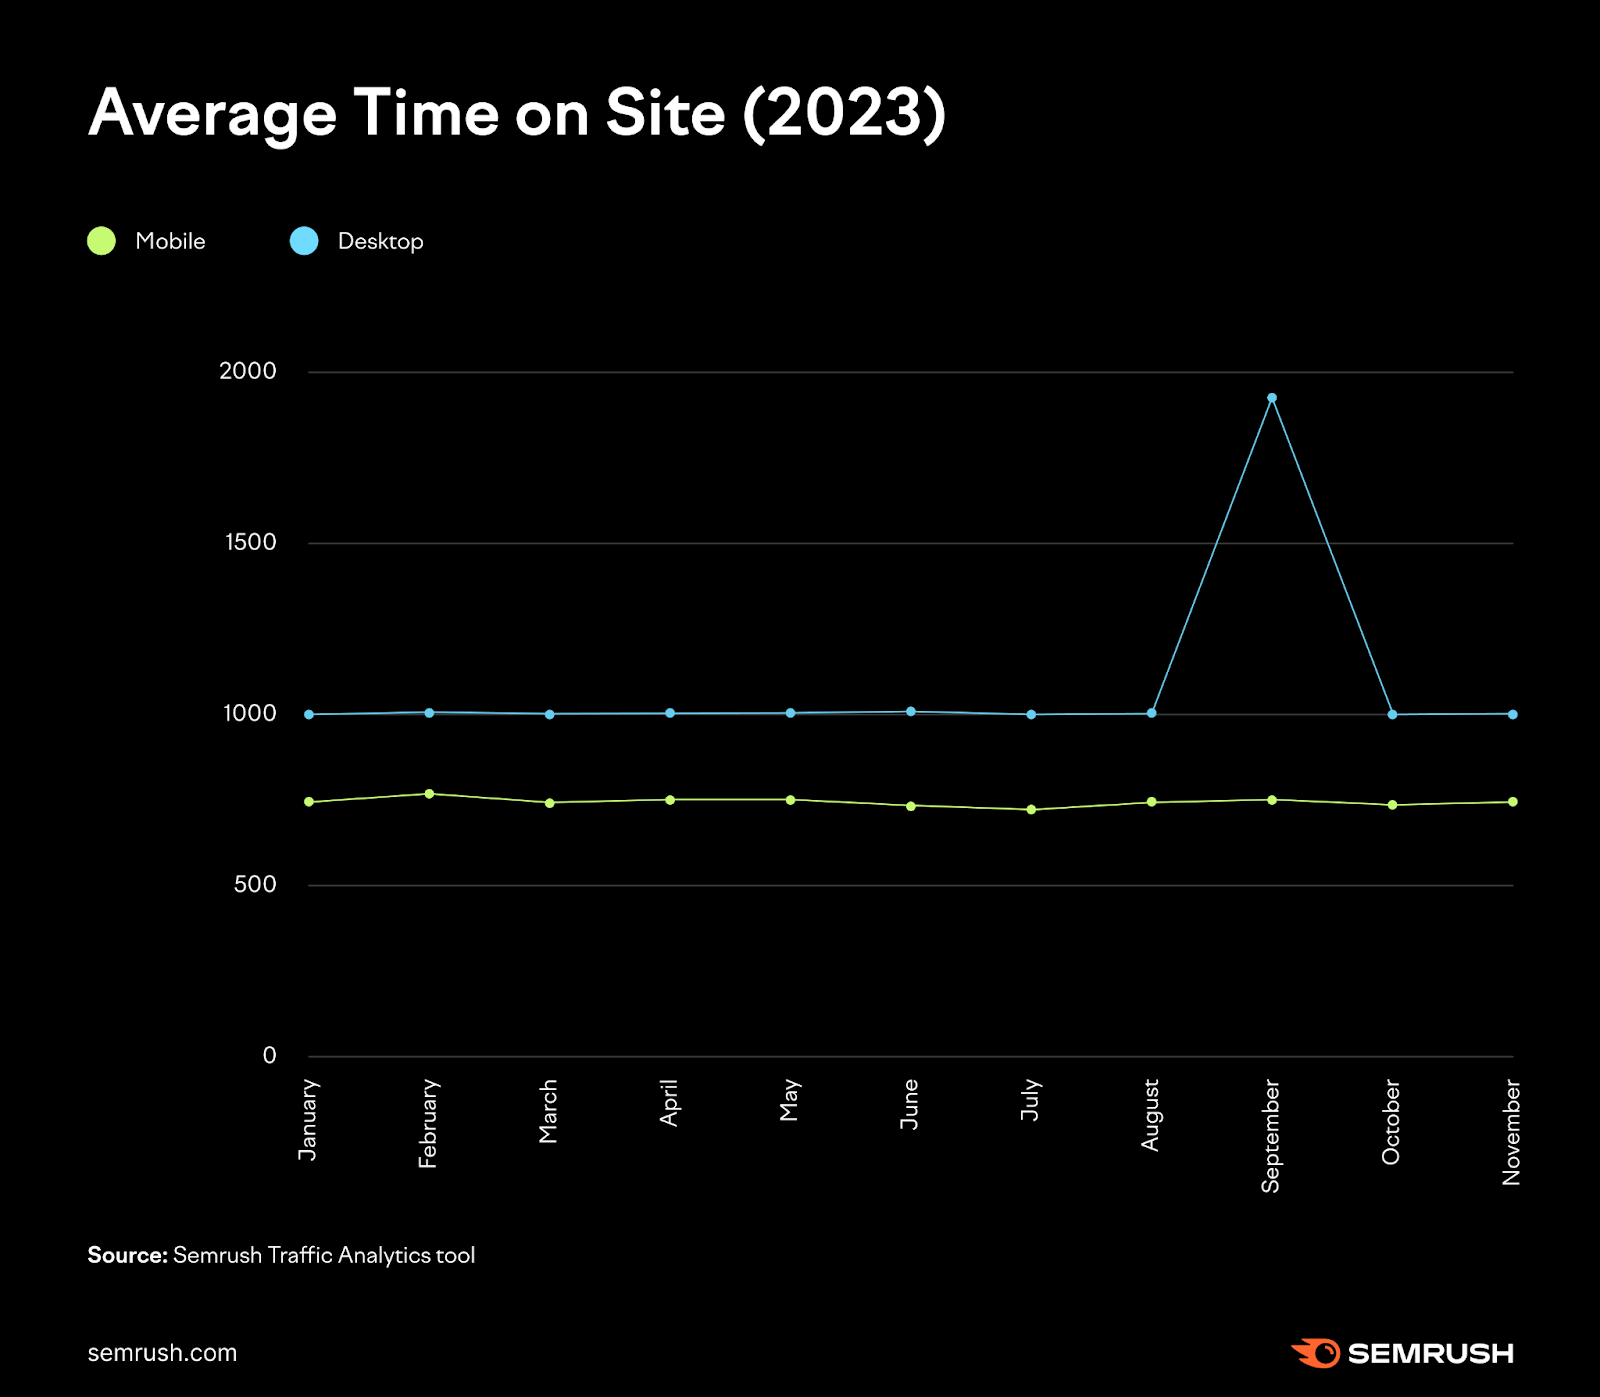
The data suggests that mobile users spend less time looking at content. This means it’s important to have short, engaging content that quickly grabs their attention.
However, desktop users show higher engagement times, suggesting users may be more receptive to in-depth content on that device.
Tailoring strategies to each device, depending on the user’s intent, can be beneficial. This will help you align your content with users on different devices.
Average Bounce Rate: Mobile vs. Desktop
Mobile bounce rates ranged from 58.45% to 60.19%. Desktop bounce rates varied between 48.38% and 50.33%, consistently lower than mobile.
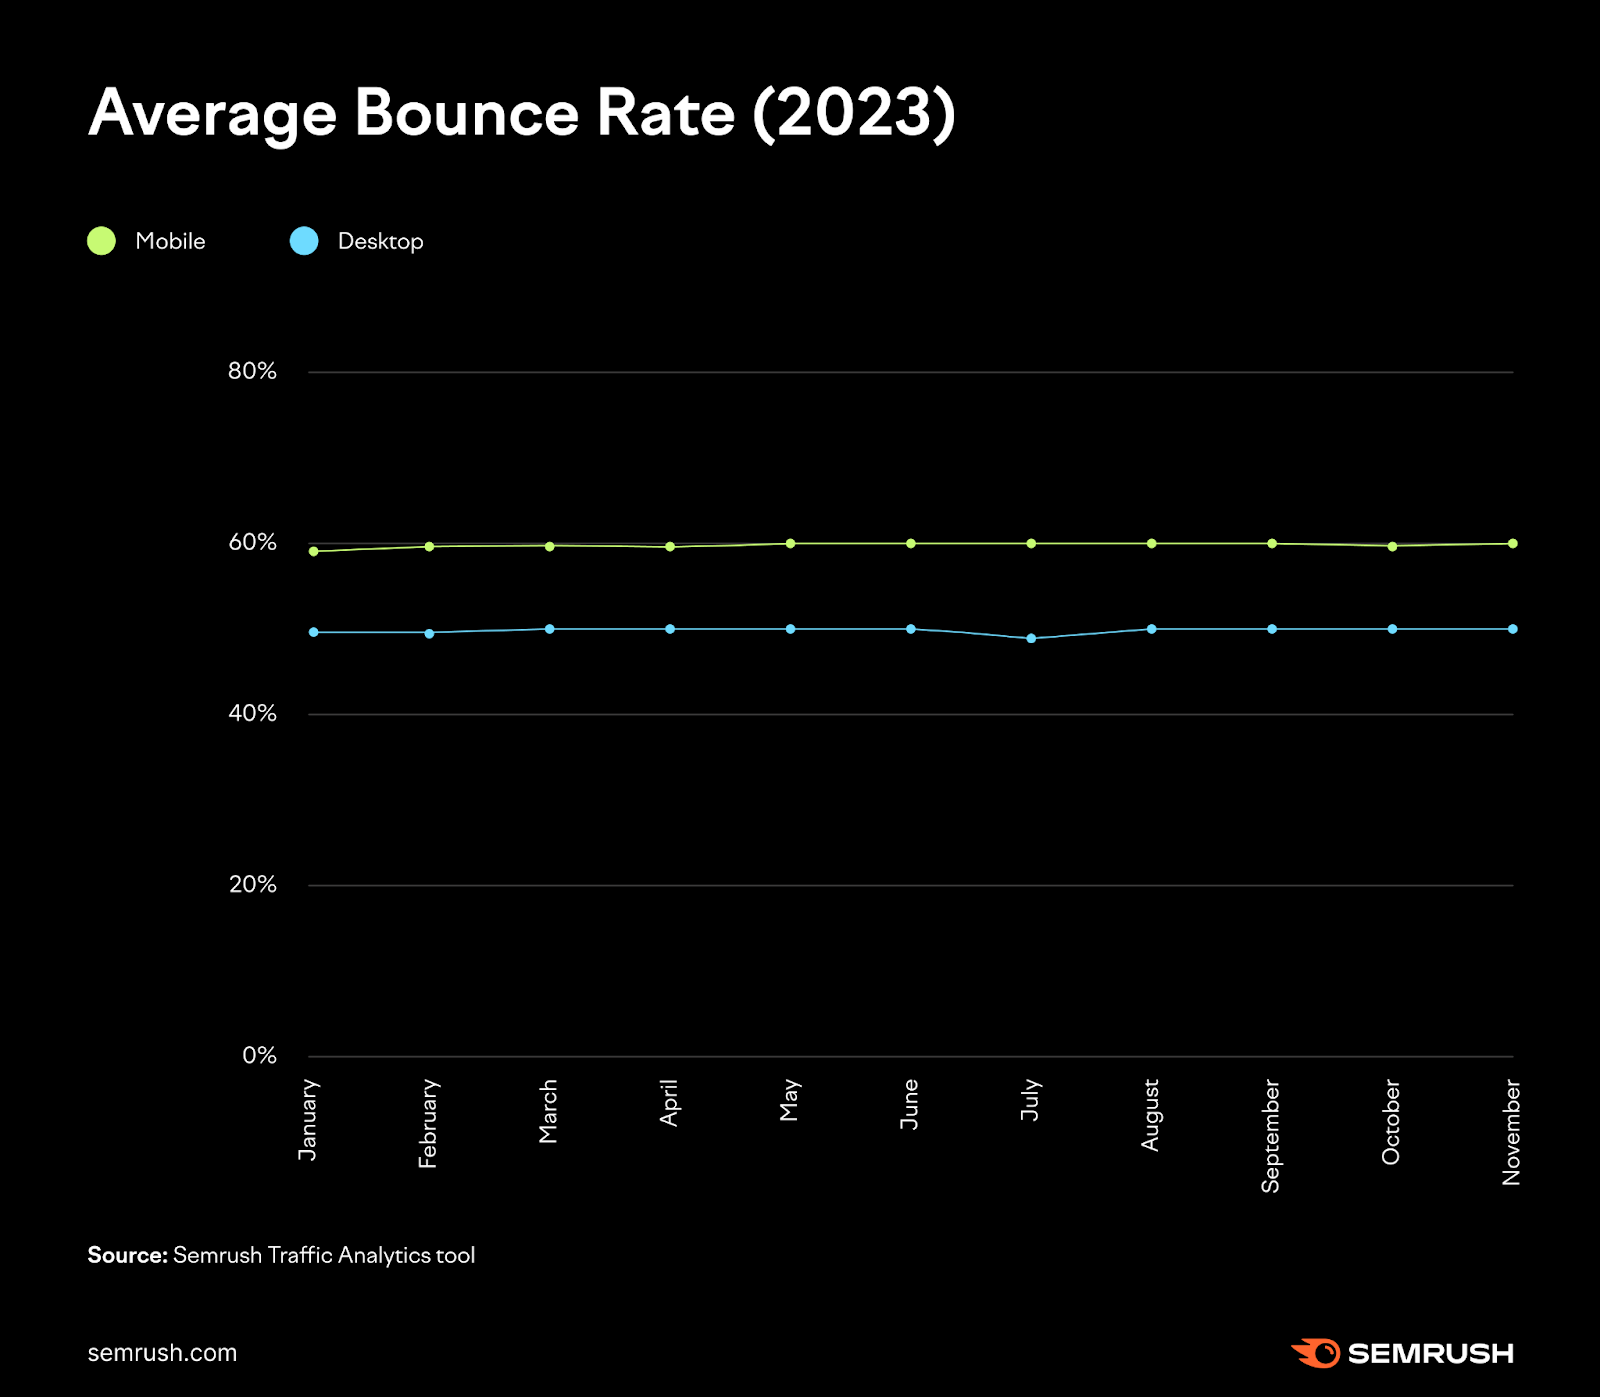
The data shows about a 10 percentage point difference in bounce rates between mobile and desktop users, indicating that user engagement can vary significantly depending on the device.
With the rise in mobile traffic is an apparent decline in user engagement. Although more people are visiting websites, they’re not sticking around or interacting as much (on mobile). This is shown by higher bounce rates and shorter visits on both mobile and desktop.
Desktop vs. Mobile Experience
Why would someone use desktop over mobile, or vice versa?—well, it depends.
On-the-go device usage can demand quick access to essential information. Mobile users often seek immediate answers or perform swift transactions.
Desktop usage typically involves a stationary setting that accommodates in-depth research, complex tasks, and extended browsing sessions.
For example:
- E-commerce: On mobile, users often prefer a seamless, one-click checkout process, while desktop users may appreciate a detailed product comparison
- Social Media: Mobile experiences often prioritize content consumption, whereas desktop versions may provide enhanced editing features for content creation
- News consumption: While news sites adapt their content for mobile devices (concise headlines for quick updates), the desktop experience often provides a more immersive environment with larger screen sizes and potentially fewer distractions
Whether someone uses a desktop or mobile device may also depend on how comfortable they are navigating each.
And don’t rely on stereotypes or assumptions: Research your particular audience’s preferences.
Advantages and Disadvantages of Mobile vs. Desktop
Mobile
Understanding mobile use advantages and disadvantages from the user’s perspective helps you tailor your digital strategies to reach your target audience.
Here are a few advantages:
- Instant accessibility to information, services, and entertainment
- Quickly search and answer questions
- Brief interactions and to-the-point content
- Swift navigation between apps and sites
- Communicate in various formats seamlessly via text, video, photo, gif, etc.
- Personalized recommendations via location-based services
And here are a few disadvantages:
- Small screen can limit content and the user experience
- Distractions abound
- Not easy to multitask or do extensive research
Desktop
While mobile devices may have their strengths, sometimes desktop may be preferred:
- Larger screen size makes it more suitable for visual work or detailed analysis
- More immersive visual experience
- Multi-tasking capabilities and multi-monitor setups make work easier
- Manage multiple applications simultaneously
- Higher processing power and performance capabilities (that even gamers enjoy)
As for disadvantages:
- Confined to a specific location (aka you can’t as easily take it with you on-the-go)
- Needs a dedicated physical space and equipment
Key Things to Consider in the Mobile-First Era
In the mobile vs. desktop use debate, it’s best to strategize your digital marketing to target mobile more because it mobile accounts for most website traffic.
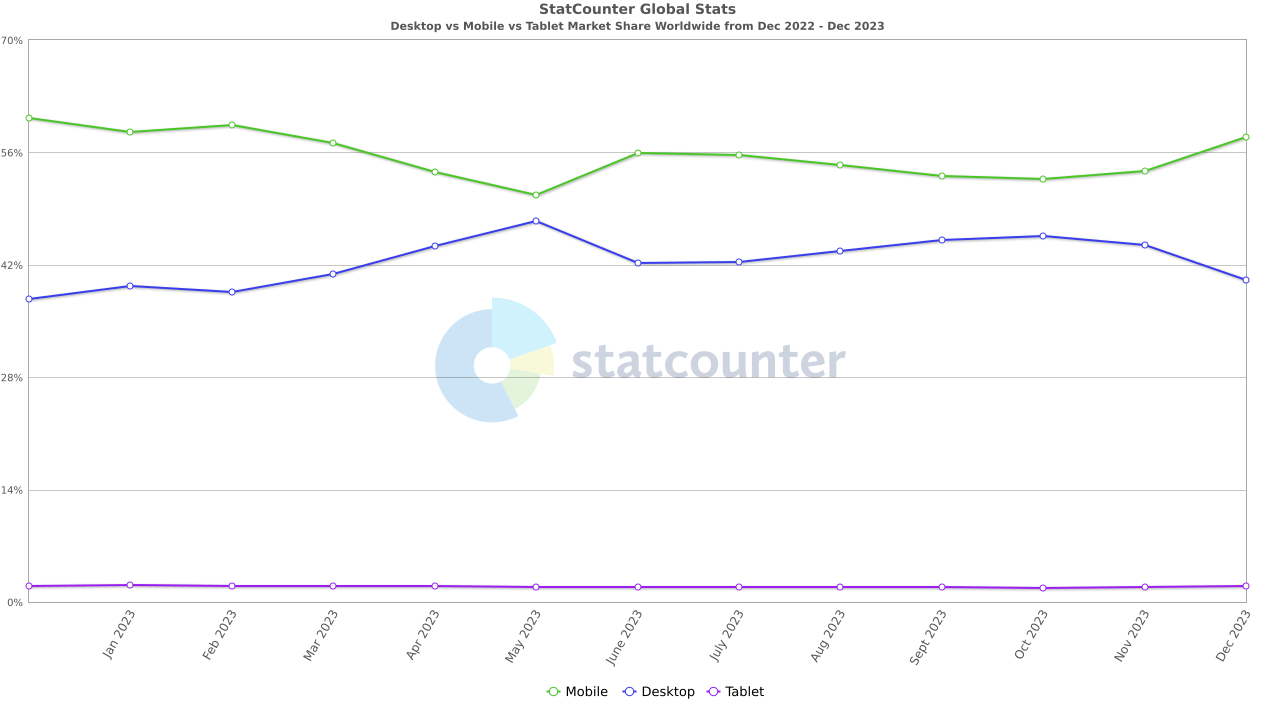
Image Source: Statcounter
However, this doesn’t mean you should neglect desktop users. Instead, your website’s content and infrastructure should adapt seamlessly for both mobile and desktop experiences.
Prioritize Mobile SEO
Implementing search engine optimization (SEO) for mobile is important because Google has adopted mobile-first indexing as a standard practice for all websites.
Mobile SEO refers to optimizing your website to rank higher on search engine result pages (SERPs) for mobile devices such as smartphones and tablets.
The goal is to provide an excellent user experience specifically for visitors who access your site via mobile devices.
This means that, for search engine rankings, Google primarily considers the mobile version of your site. The desktop version, though still relevant for user experience, doesn’t carry the same weight in the eyes of search engines.
Here are some best practices for mobile SEO:
- Create mobile-friendly content: Craft content with mobile users in mind, ensuring readability and fulfilled search intent
- Use responsive design: No matter what device your audience uses, ensure your website will adapt its layout appropriately

- Optimize site speed for better user experience: Use tools like Semrush’s Site Audit to identify and resolve elements that might impede your site’s speed on mobile
- Monitor your keyword positions: Use the Position Tracking tool to regularly monitor keyword performance, especially on mobile devices. Then, adapt your content strategy based on this data.
Further reading: The Complete Guide to Mobile SEO
Understand Your Audience (Better)
Comprehensive audience insights can help you create content that resonates with your customers in a mobile-first era.
Generic marketing strategies and content fall short. You can create more engaging content for your audience by improving segmentation and targeting.
The One2Target tool helps you tailor your marketing approach by providing insightful data on your market’s audience demographics, socioeconomics, and behaviors, including:
- Location
- Device type
- Social media preferences
Start by entering up to five competitor domains. Choose your location, and click “Analyze.”
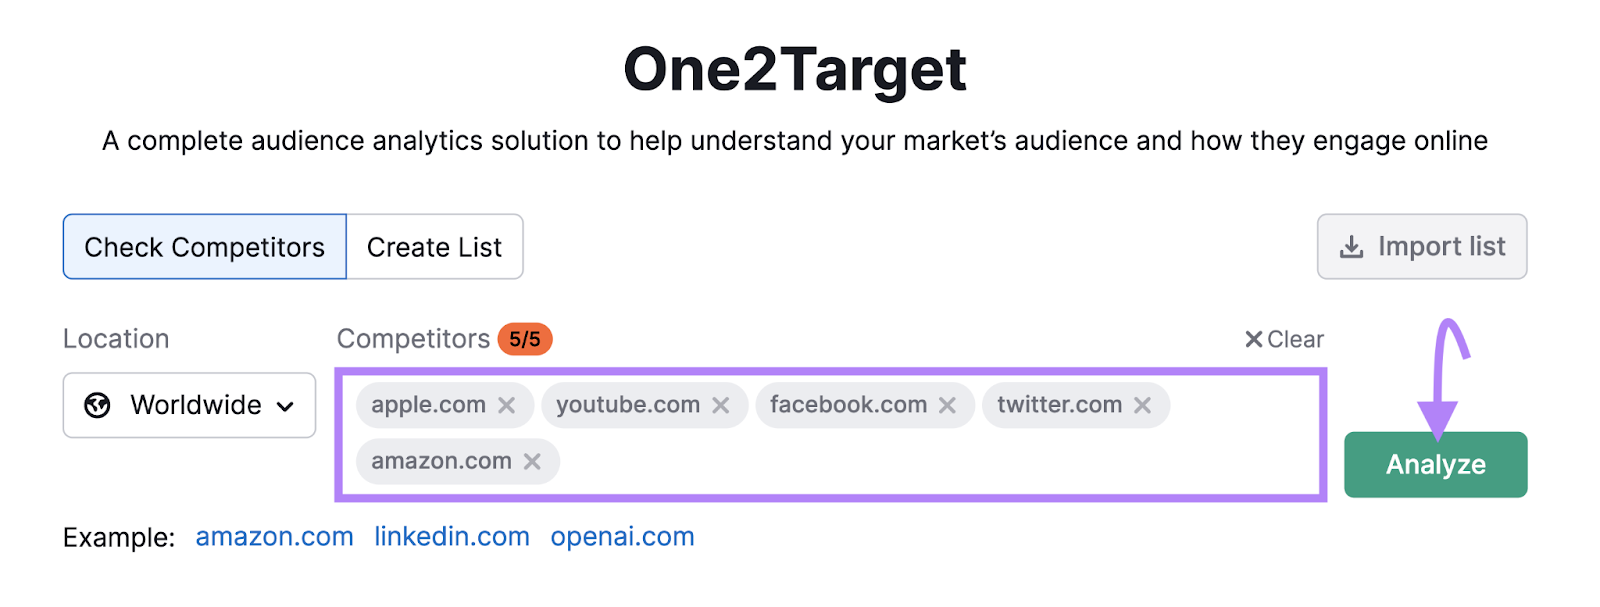
To see which device the market primarily uses when visiting those domains, head to the “Behavior” tab.
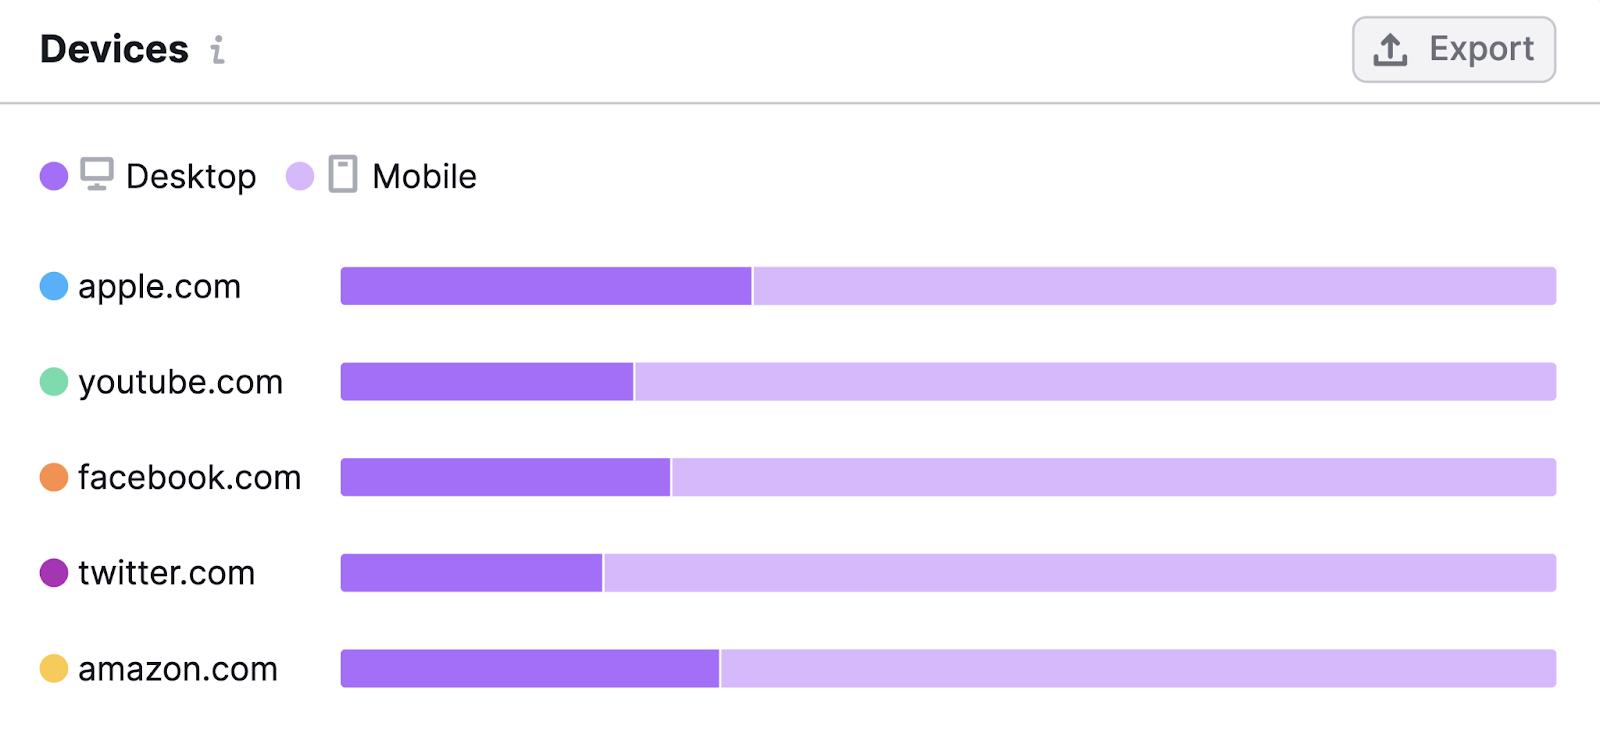
You can use this data to get an idea of which device your target audience uses.
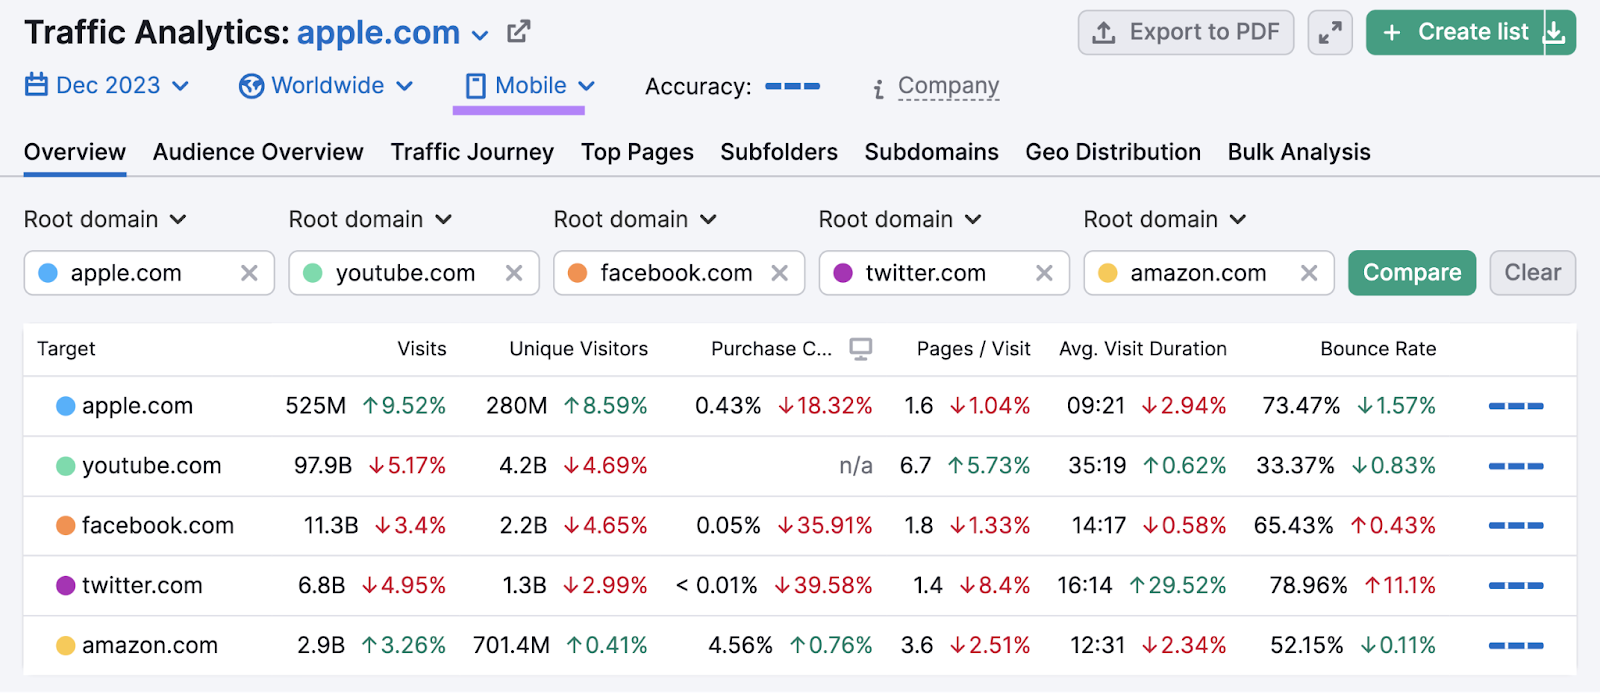
Then, Semrush’s Traffic Analytics tool can help you set realistic goals based on user engagement by device type.
As more and more users prefer to use mobile devices, the right tools are crucial to help you know your audience and grow your online presence.
Explore the One2Target audience analysis tool to get started.
Source link : Semrush.com